Milestone Checklist
Milestone Checklist is one of the most potent tools a project manager can employ to ensure the project's progress is on track.
The project manager does not need to invest in expensive software to keep track of this. A simple Excel template can be used for this by the project manager.
The milestone checklist should be a dynamic document that is updated at least once a week.
Gantt Chart
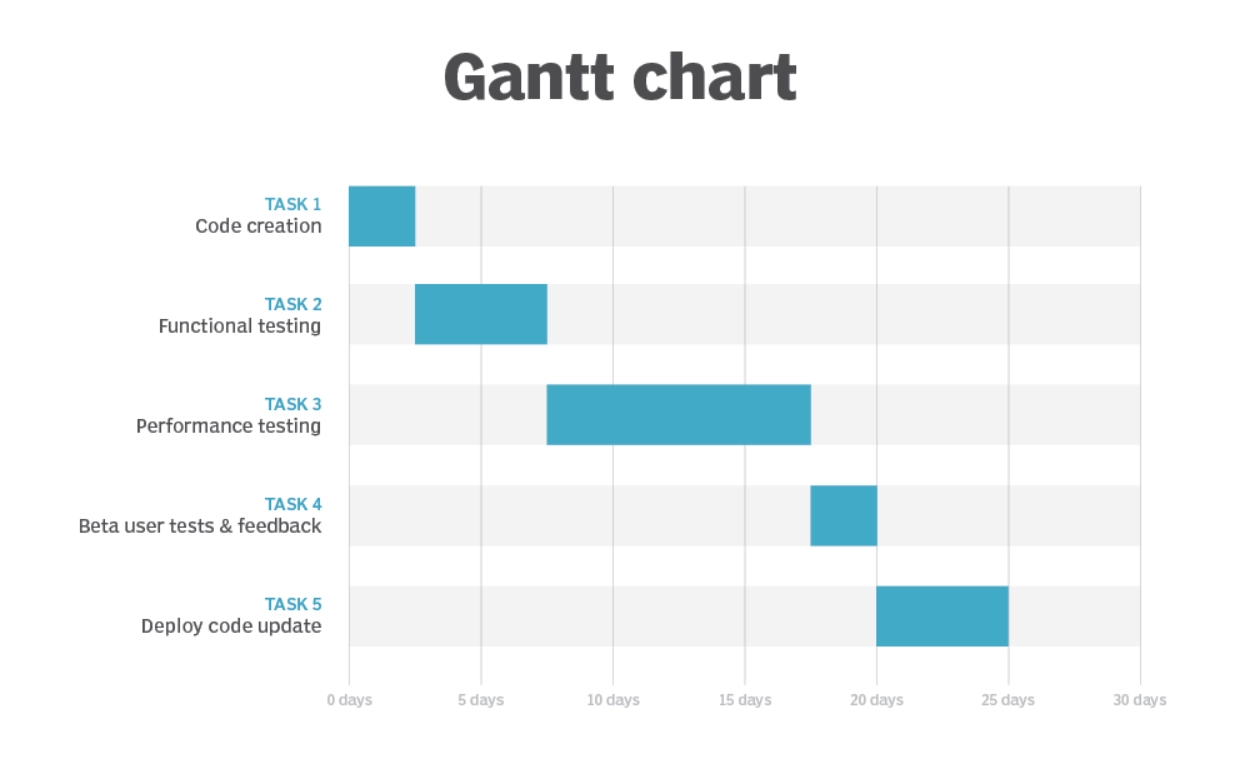
Henry Gantt first developed the Gantt chart in the early 20th century. The Gantt chart illustrates the project timeline and demonstrates the interdependencies of each operation to the project management.
Gantt charts are widely used in a wide range of projects, including construction and software development. Although it looks to be a simple activity, producing a Gantt chart is one of the most challenging tasks when a project contains hundreds of operations.
A Gantt chart can be created in various ways. In the case of a short and straightforward project, one can build one's own Gantt chart in Excel or get an Excel template from the Internet.
A Gantt chart is a stacked bar chart with project tasks on the vertical axis and timeframes on the horizontal axis that measures work duration. Each activity is represented by a bar.
The project manager can use software solutions like MS Project if the project has a high-risk exposure or a high financial value.z

Source: TechTarget
PERT Chart
PERT is an acronym for Programme Evaluation Review Technique. It is developed by the US Navy to handle the Polaris submarine missile program in the 1950s.
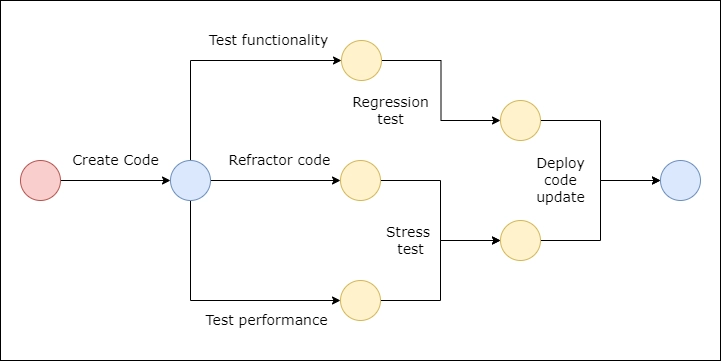
Unlike a Gantt chart, it is not strictly linear. Instead, nodes, often a simple shape like a circle, symbolize project milestones. The tasks to be completed are represented by vectors, which are connecting lines.
It shows dependencies with a sequence of lines, and parallel lines show tasks that must occur at the same stage in the project. It should include indicators of the sequence of tasks and estimated time to reach each milestone.

Resource Histogram
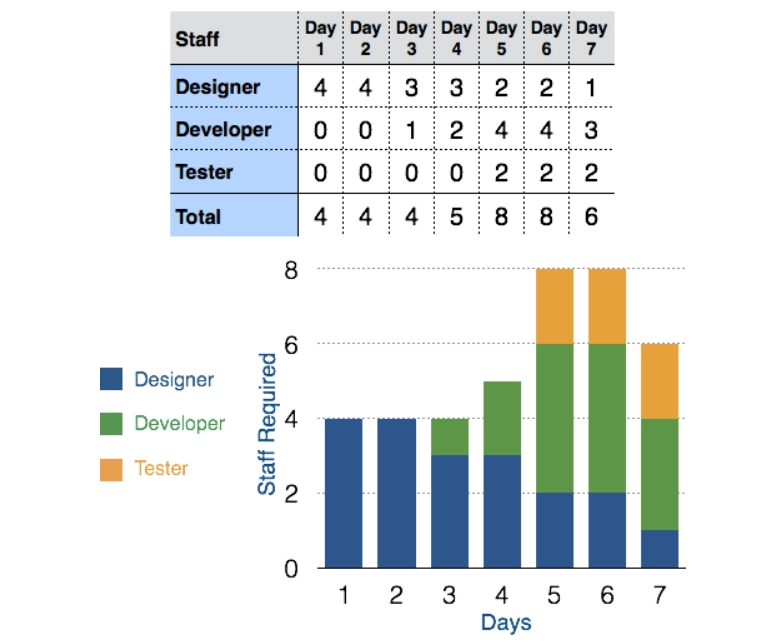
The resource histogram is a bar chart that displays how much time a resource is planned to be worked on over a predetermined period. Resource histograms can also include the related aspect of resource availability, which can be used for contrast purposes.
Resource histogram is a constructive tool for staff planning and coordination.

Source: Software Project Management
Critical Path Analysis Chart
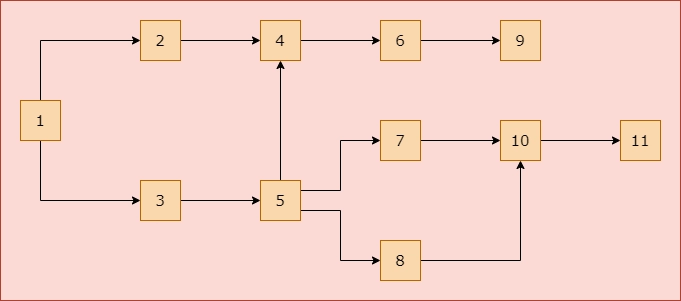
Critical path analysis is a technique for categorizing the activities that must be completed to accomplish a task, the time required to perform each activity, and the links between them. CPA aids in determining whether or not a project will be completed on schedule.
This tool helps identify project tasks that are interconnected. Each event is given a specified time range, similar to a PERT diagram. This tool depicts event dependence, assuming that an event can only progress to the next if the previous one has been finished.
The events are listed in order of the earliest start time attainable. The path between the start and finish nodes is a crucial path that cannot be decreased further, and all events must be performed in the same order.

Product Breakdown Structure
The Product Breakdown Structure (BBS) is a management tool and an essential component of project planning. It is a task-oriented system for breaking down a project into product elements.
The product breakdown structure is a diagram that depicts the relationship between work packages and describes subtasks or work packages. The project work has been diagrammatically illustrated using several types of lists within the product breakdown structure.
Also read V Model in Software Engineering
Work Breakdown Structure
The Work Breakdown Structure(WBS) is described as a deliverable-oriented hierarchical breakdown of the work which is performed by the project team.
It is a handy tool for determining team assignments, right down to the individual developer and tester, and teams can use it to pinpoint and troubleshoot project issues. WBS also clarifies the scope of a project at a high or granular level, depending on the user's interest and engagement.
A team can use the WBS to estimate each task's time and/or cost, then add the totals to get an overall project estimate. The chart is designed to seem like a family tree, with the project at the root and branches branching off into smaller and smaller components.
WBS can be used as the foundation for other project management tools like Gantt charts.
Project Reviews
An effective project management tool is a detailed project review mechanism. More established companies have more rigorous and comprehensive project evaluations when compared to basic project reviews conducted by smaller businesses.
Project reviews are chiefly worried about project progress and adherence to process standards. Project evaluations are frequently supplemented by third-party project audits (internal or external).
Non-compliances and action items are tracked after that to ensure that they are completed.
Delivery Reviews
Delivery reviews ensure that the project team's deliveries match the customer's expectations and follow the general quality parameters.
The delivery review is usually conducted by a 3rd party team or internal supervisors, and the main stakeholders in the project delivery are invited to participate.
Due to quality standards and non-compliances, the delivery review may deny the delivery.
Score Cards
The easiest way to keep track of performance is via a scorecard for project team performance. Every project manager is responsible for evaluating team members' performance and reporting it to upper management and HR.
This information is then used for the recruitment and development of human resources. They could position the team member in the proper spot using a detailed scorecard and performance evaluation.
Check out this problem - Largest Rectangle in Histogram
FAQs
-
Give a disadvantage of WBS as a project management tool.
Work Breakdown Structure is unsuitable as a timeline for visualizing job interdependencies or scheduling overlapping tasks.
-
Describe the two approaches for a WBS.
The two approaches are the top-down approach and the bottom-up approach.
The WBS is created using a top-down method by breaking down the entire project into subprojects or lower-level activities.
The bottom-up technique is similar to a brainstorming session in which team members are requested to create a list of low-level activities that must be completed to finish the project.
Key Takeaways
In this article, we learned about various project management tools. We can also infer from this article how vital these tools are throughout the project.
We hope this article has helped you enhance your knowledge of various management tools.
If you would like to learn more, check out our articles on Software Engineering, Characteristics of good software and Pseudocodes in Software Engineering. Do upvote this article to help other ninjas grow.
Head over to our practice platform Coding Ninjas Studio to practice top problems, attempt mock tests, read interview experiences, and much more!
Happy Coding!


