Get a skill gap analysis, personalised roadmap, and AI-powered resume optimisation.
The groupby method in Pandas is a powerful tool for data analysis, enabling you to group data based on one or more columns. It allows you to perform operations on subsets of your data, such as aggregating, transforming, or filtering groups, making it easier to analyze and summarize large datasets. By grouping data, you can efficiently compute statistics, apply functions, and gain insights from different segments of your data. functions on the grouped data. It is widely used in various industries, from finance to healthcare. This article will dive into details of Pandas's 'groupby' function.
What is a groupby() function in pandas?
Pandas is a popular data manipulation library in Python. It provides various functions to manipulate and analyze data. The 'groupby' function in Pandas allows the grouping of a DataFrame. We can group them by one or more columns.
The 'groupby' function is commonly used in data analysis. It is used to gain insights into the relationship between variables.
The groupby() function works in the following manner:
1. You specify the columns you want to group your data on.
2. Then Pandas will group your data accordingly.
3. Various aggregation functions can then be performed on the grouped data. Like calculating each group's sum, average, maximum, minimum, or count.
The axis to group along(0 for rows, 1 for columns)
level
If the axis is multi index, level helps to group by a particular level.
as_index
Whether to use the group keys as the index of the resulting DataFrame.
sort
Whether to sort the resulting groups by the group keys.
group_keys
Whether to add the grouping keys as a new column to each group.
squeeze
If the groups have only one column, return a Series instead of a DataFrame.
observed
If True, only shows observed values for categorical/grouping columns.
Return Value of Pandas DataFrame.groupby()
The groupby() function in pandas returns a special grouped object that doesn't display the actual data content but provides a way to apply various aggregation functions or operations on the grouped data. You typically follow it with an aggregation function or operation to obtain meaningful results.
Example of Pandas DataFrame.groupby()
Now let's look at an example of using ‘groupby’ in pandas. Suppose we have a DataFrame containing students' data, with columns for date, name and marks.
	date		name 	marks
0	2002-11-01	Abhay	78
1	2002-11-01	Ninja	166
2	2002-11-02	Abhay	98
3	2002-11-04	Coder	91
4	2002-11-06	Raj		54
In this example, we used 'groupby' to group the DataFrame by two columns (date and name) and then used the SUM function to calculate the total marks for each student. We can also specify as_index=False to prevent Pandas from using the group key as an index in his results DataFrame.
Pandas groupby() on Two or More Columns
You can group data based on one or more columns using the groupby() function from the pandas library. Here's an example of using groupby() with multiple columns:
Syntax
Below is the syntax to groupby two or more columns.
Groupby operations consist of aggregation, and transformation and Filteringoperations within each group created by the groupby function. Following are some of the operations:
1. Aggregation
Aggregation involves the computation of data statistics ( for eg. sum, min, max, median, etc. ) for all the groups.
Syntax
df.groupby('Category')['Value'].sum()
2. Transformation
The transform function is applied to each group, and results are broadcast back to the original DataFrame.
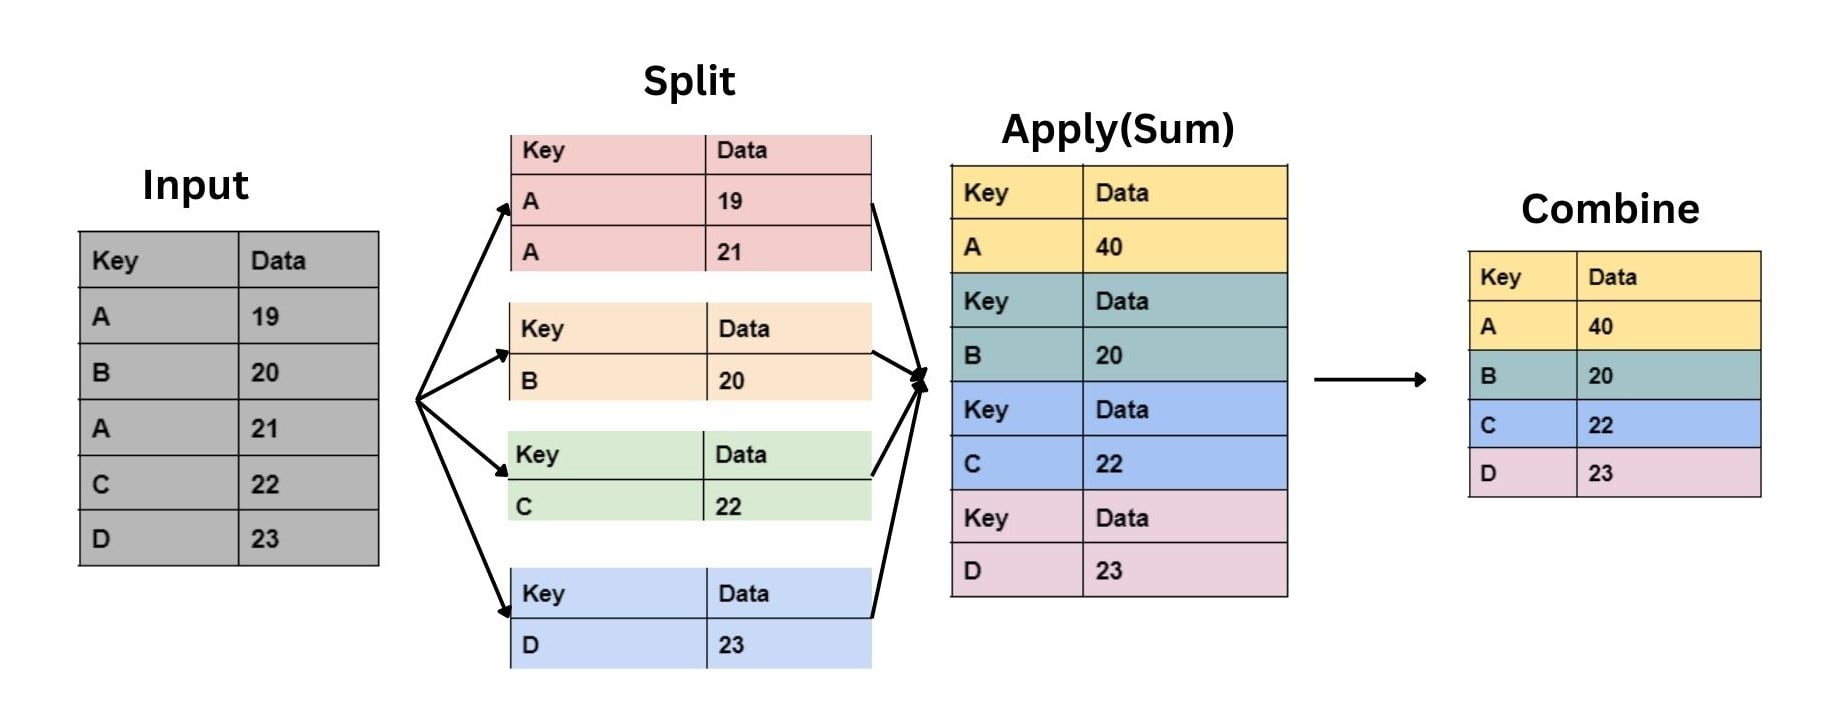
Aggregation is the process of summarizing the grouped data. It is done by calculating the summary for each group. The summary could be sum, mean, median etc. Pandas 'groupby' function makes it easy to perform aggregation on a DataFrame.
Here's an example of how we can perform aggregation with 'groupby()':
Suppose we have a DataFrame containing data for a company. It has columns of key and data only.
To summarize the sum of each key, we can group the DataFrame by 'data' using the 'groupby' function. Then we will use the sum function to calculate the sum.
In the above code, we used the ‘groupby’ function to group the DataFrame by the ‘key’ column. Then we used the ‘sum’ to calculate the sum for each group.
Note: In place of sum(), you can also use .mean(), .mode(), .median() to find mean, mode or median respectively.
Pandas groupby() for Data Cleaning
Pandas ‘groupby’ function can be very useful for data-cleaning tasks. Let's understand by coding some examples. We will understand by detecting duplicates and removing duplicates.
1. Detecting Duplicates
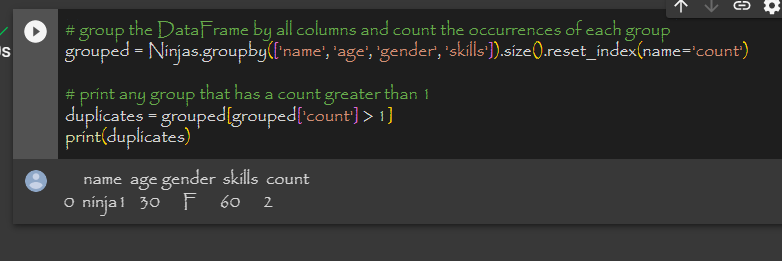
The ‘groupby’ function allows us to group a DataFrame by columns that may contain duplicate values. We use the size() method to count the number of occurrences of each group. If the group count is greater than 1, then it means there are duplicates.
In the above code we can see that the first and last row are duplicates.
In this example, we grouped the DataFrame by all columns and counted the occurrences of each group using size(). Then we used reset_index() to convert the resulting series to a DataFrame with column names. Finally, we selected any group with a count greater than 1 using a boolean mask and printed the results.
# Group the DataFrame by all columns
# And count the occurrences of each group
grouped = Ninjas.groupby(['name', 'age', 'gender', 'skills']).size().reset_index(name='count')

# Print any group that has a count greater than 1
duplicates = grouped[grouped['count'] > 1]
print(duplicates)
You can also try this code with Online Python Compiler
	name		age		gender	skills
0	ninja1		30		F		60
1	ninja21		30		M		60
2	ninja11		35		M		70
3	ninja21		40		M		80
4	ninja31		20		F		40
Frequently Asked Questions
What does groupby() do in Pandas?
In Pandas, groupby() is used to group data in a DataFrame based on a specific column's values. It allows you to perform operations on these grouped data subsets efficiently.
How to use groupby() in DataFrame Pandas?
To use groupby() in a Pandas DataFrame, you specify a column by which you want to group your data. Then, you can apply aggregation functions like sum or mean to analyze each group's data.
How do I aggregate multiple functions in Pandas groupby()?
To use the .agg() method, apply it directly to the groupby object. Provide a dictionary with columns as keys and desired aggregations as values, which can be single words or lists of words.
Can I apply different functions to different columns in Pandas groupby()?
Yes, in Pandas groupby(), you can apply different functions to different columns using the agg() method. This allows you to specify different aggregation functions for each column, providing flexibility in summarizing grouped data.
Can I group multiple columns in Pandas groupby()?
You can group data by more than one column and find statistics for each group by giving a list of column names to the groupby() function.
Conclusion
In summary, Pandas ‘groupby’ is a powerful data analysis and manipulation tool. It allows you to easily group data by one or more columns. You can apply functions to each group to perform various data aggregation, transformation, and filtering tasks. Pandas ‘groupby’ helps you gain meaningful insights from your data and make informed decisions whether your dataset is small or large.


 6+ registered

