Do you think IIT Guwahati certified course can help you in your career?
Introduction
React Native is one of the simplest methods to make an app that can work on both IOS and Android platforms. But as the app grows, it may experience some lags. Some improvisation needs to be done for faster response, faster animation loading, better battery saving, or lesser freezes and crashes.
Therefore, with the help of react-native profiling, one can determine why our app is giving a slower experience concerning memory, graphics, or CPU, and then we can work upon it to make it faster.
React Native Profiling is a method software engineers can improvise any app's performance. Profiling is a tool for in-depth analysis of an app by determining information about how the Javascript thread is working.
There are a set of tools that comes under profiling that helps us to perform this in-depth analysis. React native profiling mainly uses the PEF monitor in the debug menu.
Therefore, you can either use systrace on Android or IOS or debugging tools to see the thread information.
Profiling is mainly used to detect memory leaks in the app. Memory leaks happen when the data is stored in the memory, but the app cannot read it. It can often be used to detect memory-related issues. Memory leaks can be diagnosed with the following symptoms.
The app crashes when interacting with certain buttons.
Navigation takes a long time to respond.
The app takes too long to open or close
Editing forms take a long time.
React-Native Profiling Methods
The detailed information on any app's working can be found by finding out the working of its JavaScript thread and thus determining the app's performance delays. This can be done using systrace or debugging tools like chrome debugging tools.
For Android Profiler
Inside the android studio, open the android folder of the app.
Search for the profiling button at the bottom of the android studio.
After that, we can see a screen with detailed information about the app to see the memory usage, CPU, and disk usage.
After interacting with the app, one can see the memory usage for that action and memory leaks due to poor memory allocation.
For IOS Profiler
For IOS, profiling can be done with the help of X-code, which provides a toolset for time profiling, CPU profiling, and network profiling. These tools can automatically be identified by react native with a .xcworkspace file inside the IOS folder.
Therefore, for performing the profiling, one has to open the project in the folder browser, and then inside the IOS Folder, search for a file with the .xcworkspace extension and open it.
Next, the X-code will pop up on the screen, and the app will run on X-code.
Once the app is running, we can go to the Debug Monitor on the screen.
Again, we can see different options for profiling, such as memory leaks, disk usage, and network calls.
Debugging and Error Boundaries
Debug
Debugging is often performed with debugging tools available within the browser, and it helps to find and fix errors within a script. Therefore, the Javascript bugs can be easily founded by Google Chrome Console. The following flow chart shows the steps to perform debugging.
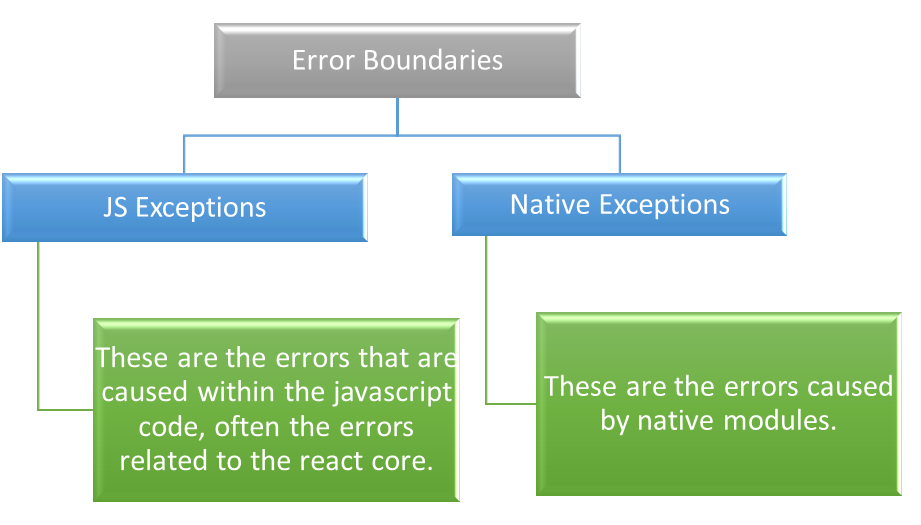
Error Boundaries
Errors in the component tree can be caught by creating error boundaries. Error boundaries can see errors during rendering or within the constructor. There are two types of error boundaries:-
Frequently Asked Questions
What is React Native Profiling?
React Native Profiling is a method by which software engineers can improvise any app's performance by in-depth analyzing an app by determining information about how the Javascript thread is working.
What are the various methods for performing React Native Profiling?
For IOS platforms, profiling can be performed by X-Code. For Android platforms, profiling can be achieved by android studio. There is also a generic tool for performance analysis that can be used instead of native IOS or Android profiling, which is known as the chrome debugging tool.
How can we do performance analysis on React App?
One can find information about memory leaks within the app which are causing time lag in the form of slower opening or closing time and thus slower performance by React Native Profiling. Therefore, we can solve the issues related to the UI or GPU. With the help of react-native profiling, one can determine why our app is giving a slower experience concerning memory, graphics, or CPU, and then we can work upon it to make it faster.
Conclusion
In this article, we have extensively discussed React Native Profiling, its advantages, and how it is performed.


 8+ registered

