Do you think IIT Guwahati certified course can help you in your career?
Introduction
Hey Ninjas! Tableau has provided a new feature with the same working as joins called relationships. The relationship is the latest and more flexible feature Tableau provides to combine your data. They are often referred to as ‘Noodles’ as they work as the connecting lines between the logical tables of our dataset.
In this blog, we will discuss the relationships in Tableau along with its features. So without wasting our time, let's start learning.
What is Relationship
In Tableau, relationships are a flexible and dynamic way to merge the data from multiple tables for data analysis. They are used to relate two tables based on their common fields without merging them. It means that whenever we build a relationship for two individual tables in Tableau, both tables remain disjoint, holding their respective properties.
Multi Table Analysis using Relationships
In Tableau, all the multiple tables you drag into the canvas use relationship by default. Relationships are flexible and easy to use while analyzing multiple tables in Tableau. You can consider a relationship as a contract between multiple tables. This contract is used to build queries and create joins.
Tableau joins provide the same functionality as that of relationships, but relationships make data analysis more intuitive. Thus, we should give relationships the first priority over joins.
Features of Relationship in Tableau
Given below are some of the features provided by the relationship in Tableau.
A relationship is used to combine multiple data tables. Thus, the data integration and data analysis get improved.
The relationship enables a user to form a connection among various fact tables. (A fact table is a central table in the star schema of the data warehouse).
A relationship can automatically create and detect joins. Thus, the need for manual join detection is not needed.
There is no accidental data loss whenever we use relationships in Tableau.
The relationship enables Tableau to handle multiple levels of details in a single data source.
Tableau can correctly generate aggregations that are based on the relationships.
A relationship allows the user to update the data values dynamically. This can happen when an entry is added to the table, or any change is made to the existing table.
The relationship only allows the serving of the relevant data to the queries. Thus, the efficiency of data analysis is greatly improved.
It also helps to avoid duplicate data formation across the tables and can resolve data filtration issues.
How to Create a Relationship in Tableau?
In Tableau, relationships are created in the logical layer of our data source by default. You can follow the below steps to create a relationship in Tableau.
Open Tableau and drag your data table to the canvas.
Drag the other data table to which you will see a noodle forming between both tables, as shown below.
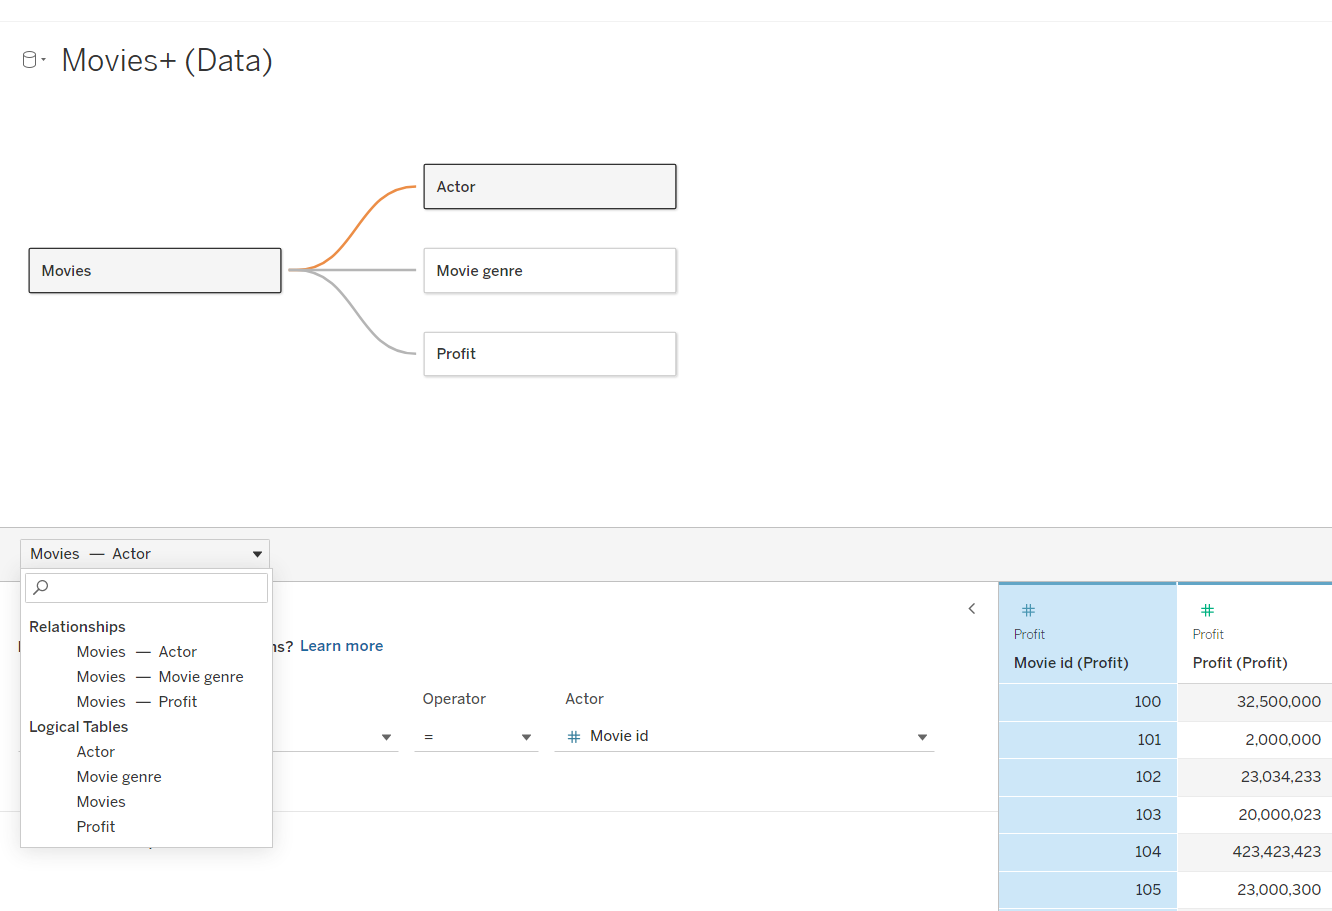
In the above image, we are using two sheets Actor and Movies, to form a relationship among them. Once you drag both the tables in the logical layer, a noodle connects both of them, and a relationship is made among them. The dialog box to edit your relationships will automatically open once the connection is made.
You can add more tables using the same process as per your requirement.
In the above image, we used multiple sheets to form a relationship among them in the logical layer. We can drag multiple sheets one by one, and Tableau will automatically form relationship among them using their matching fields.
Editing in Relationship in Tableau
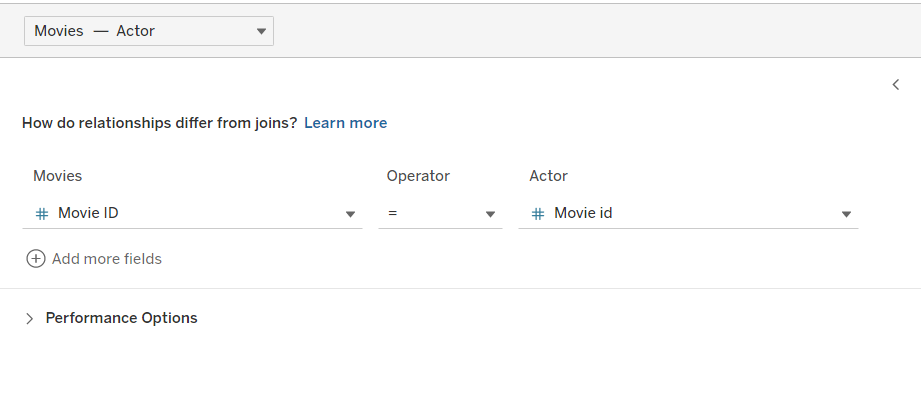
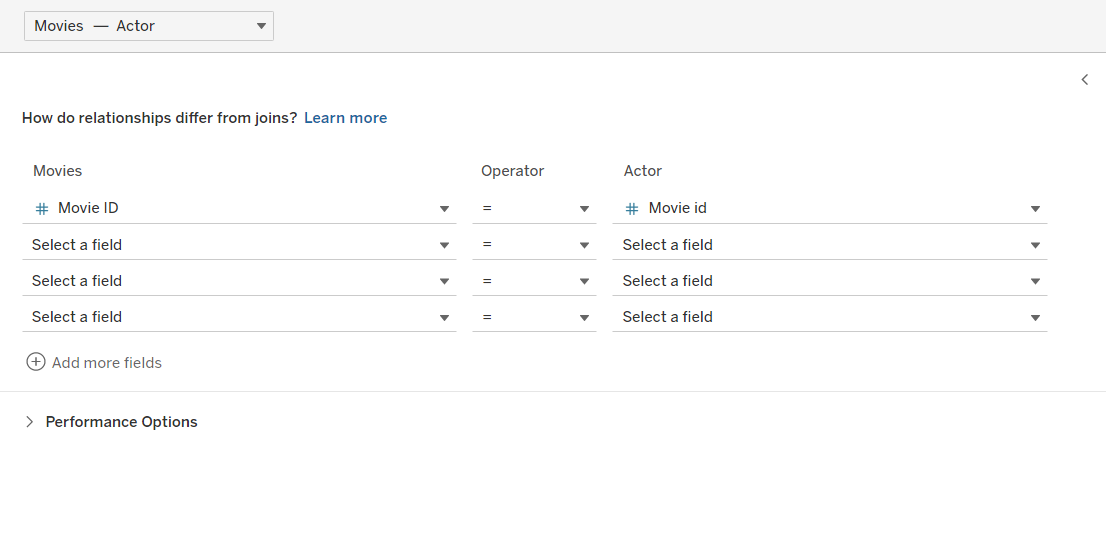
By default, Tableau automatically creates the relationship based on some matching fields. You can manually decide the same field if Tableau fails to identify them. It will allow you to add, change, and remove fields while creating a relationship.
In our example, the relationship between actor and movie sheets is made by the Movie id column common between them.
You can add multiple fields by clicking on the “Add more fields” option and selecting the matching fields one by one. Tableau also provides support for multiple operators while forming the relationship.
Note: If Tableau doesn’t detect any constraints, then by default, a Many-to-Many relationship is created.
These default setting are a safe choice if you are a beginner, and it provides more flexibility to your data source as well. But if a user has a complete understanding of these options, he can change this default setting according to his convenience.
A user can change cardinality and referential integrity using the performance option given in the dialog box to optimize their data based on queries.
A user can again apply the default setting by clicking on the Revert to Default option given. Note: A Many-to-Many relationship works perfectly even if your data is One-to-One or Many-to-One.
View in Relationship in Tableau
A user can view details of the matching fields by hovering over the relationship line (noodle) between the fields.
In the above image, we can see that whenever we hover over the boxes or the noodle, it gives a short detail about the relationship among them. It gives details about the cardinality and related field common between both the tables.
Advantages of Relationship
Below are some pros of relationships in Tableau for data analysis.
Tableau joins only the relevant tables at the time of analysis. Thus, a lot of time for the user is saved from the data preparation.
A single relationship supports all four types of joins, giving more options to the user for data analysis.
It also detects nuances in the data, such as the level of measurement details, unmatched values in the table, etc.
Disadvantages of Relationship
Till now, we have studied only the pros and features of using relationships. Now let's discuss some cons of using relationships for our data tables.
A relationship cannot be defined among the published data sources present.
If there are any geographical fields in your tables, we cannot use them to form a relationship.
If there are any circular relationships among your tables, then they are not endorsed by the data model.
Frequently Asked Questions
What is Tableau?
Tableau is one of the most widely used visualization tools that is used by many organizations and data science industries for data analysis. It is a great tool that users use to analyze the raw data in a visual way.
What is joins in Tableau?
In Tableau, the join clause is used to identify the shared fields among multiple tables and methods and match the corresponding rows. It is a method to join the related data based on those common fields.
What is a relationship in Tableau?
The Tableau relationship is a method to join data from multiple tables for a multi-table analysis. They are a versatile and flexible approach for merging your data in a quick and easier way.
What is cardinality in Tableau?
In Tableau, cardinality is a single field/column which is used to specify the uniqueness of values. If the cardinality is low, it means that there are few unique values, and if the cardinality is high, it means there are a high number of unique values.
How many types of filters are present in Tableau?
In Tableau, there are six types of filters which are extract, data source, dimension, context, measure, and table filters.
Conclusion
This article discusses the relationships in Tableau with its various features and functions. We discussed the process to create and modify the relationships as per our needs. We hope this blog has helped you enhance your knowledge of relationships in Tableau. If you want to learn more, then check out our articles.
But suppose you have just started your learning process and are looking for questions from tech giants like Amazon, Microsoft, Uber, etc. In that case, you must look at the problems, interview experiences, and interview bundles for placement preparations.
However, you may consider our paid courses to give your career an edge over others!


 8+ registered

