Do you think IIT Guwahati certified course can help you in your career?
Introduction
Postman is a top-rated API platform used for building and using APIs. It is user-friendly as it simplifies each step of the API lifecycle and streamlines the collaboration to help the user create better APIs that too faster. It allows the user to perform various tasks like making requests, testing APIs, building and managing APIs, etc.
In today's article, we will use Postman to set up and view a collection-based monitor.
Setting up a collection-based monitor
Create a new collection-based monitor to continuously check your API's health, run test suites, or validate critical workflows. When creating a monitor, you select a collection with the requests you want to run and set a schedule for how often Postman runs the Collection.
Other configuration options enable you to tailor the Monitor to your specific API development workflow. You can also upload a data file with sets of values to use as variable inputs when running the Monitor.
Creating a collection-based monitor
Postman offers several ways to create a new collection-based monitor:
Create a monitor from scratch - Select Monitors in the sidebar, and then select +. You will select a collection to run when configuring the new Monitor.
Create a monitor from a collection - Select Collections in the sidebar, select the more actions icon next to a collection, and select Monitor collection. The new Monitor is automatically configured to run the selected Collection.
Create a monitor from an API - Open an API version from APIs in the sidebar and select the Monitoring tab. Select + Add Monitor, and then select Create new Monitor. You can use an existing collection, create a new one, or generate a collection from your schema.
Configuring a collection-based monitor
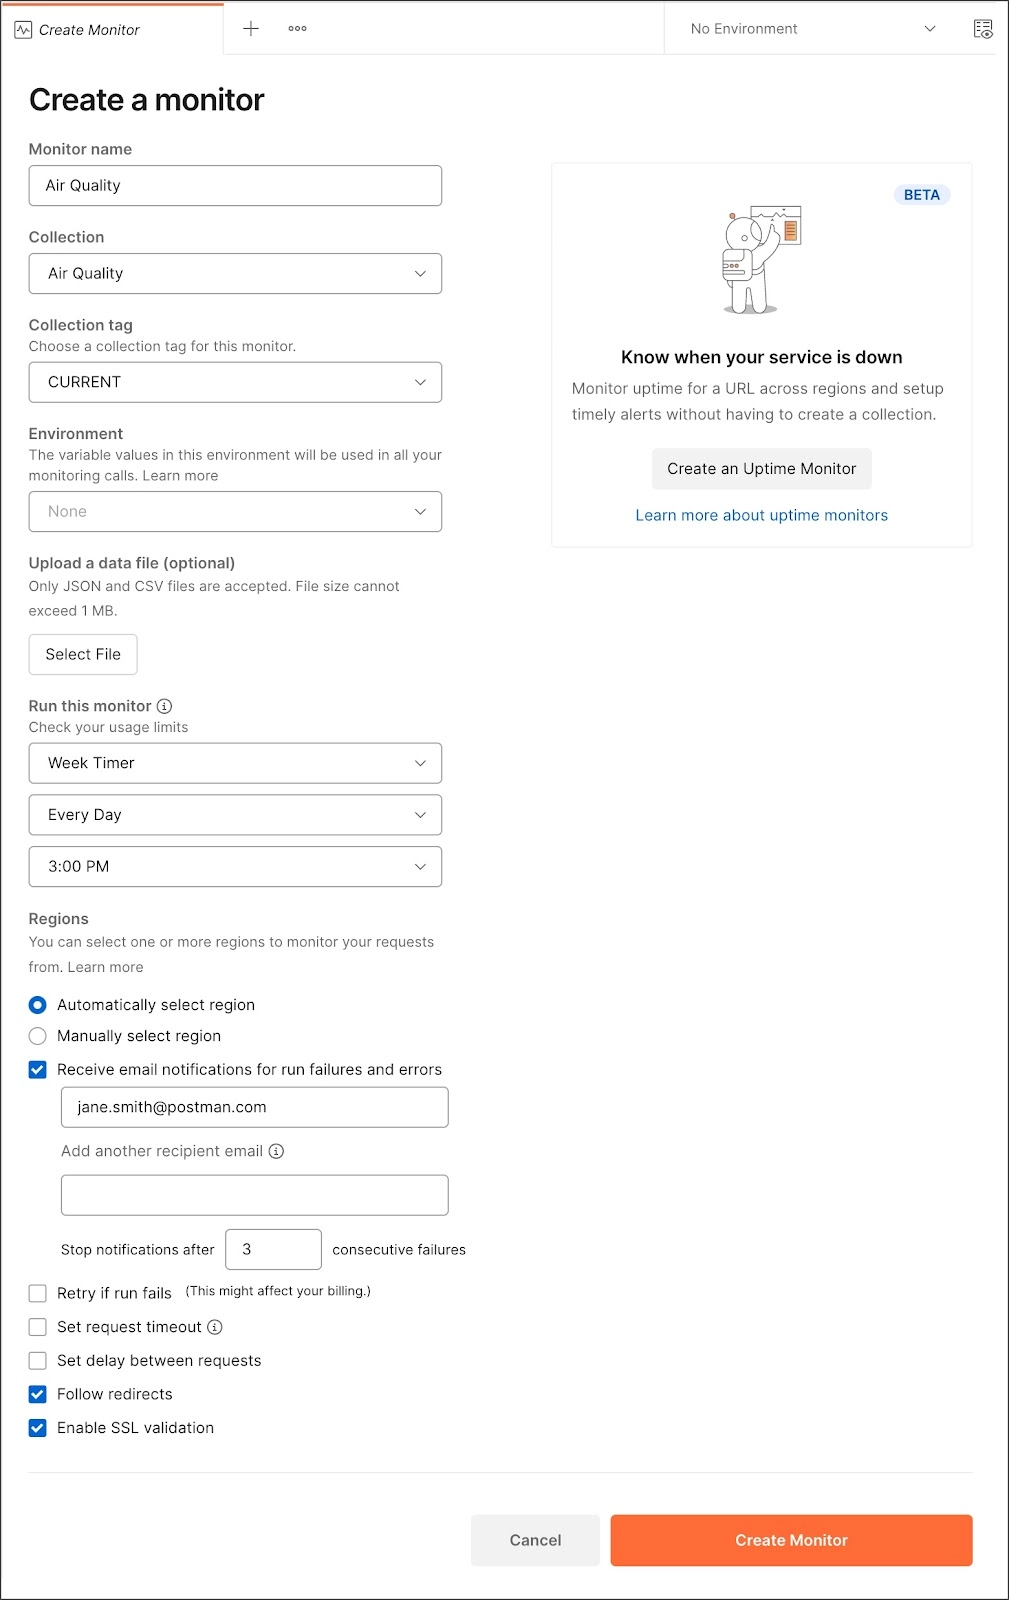
Give your new Monitor a Monitor name and select the Collection you want the Monitor to run. (Depending on the method you chose to create the Monitor, the Collection might already be selected.) If the Collection has multiple tags, select the Collection tag to use. You can also add an Environment if you want the Monitor to use one.
See the following sections for other configuration options you can select for your Monitor. When you're finished, choose Create Monitor to create the new Monitor.
A page for creating Monitor functionality
Uploading a data file
You can upload a data file to pass Postman sets of values to use during a monitor run. Postman will substitute the values for variables in requests or scripts in the monitored Collection. You can run your tests with multiple sets of values within a single monitor run by uploading a data file.
Data files can be in CSV or JSON format and must use the following structure:
CSV - The File's first row must contain the variable names, one variable per column. Each additional row is considered a data row, with values for each variable. Make sure all rows have the same number of columns and use a UNIX format line ending. Postman will iterate through the data rows, running the monitored Collection once for each data row in the File.
JSON - The File must be formatted as an array of objects containing the key-value pairs you want to use as variables. The key corresponds to a variable name for each pair, and the value will be used for that variable when running the monitored Collection.
Select File to locate and open your CSV or JSON file to upload a data file. Postman will use the data file when running your Monitor. Data files are limited to 1 MB in size and a maximum of 50 data rows (CSV) or 50 objects (JSON).
Scheduling monitors
Under 'Run' this Monitor, specify how often Postman will run the selected Collection. This could be as often as every five minutes for a status page or a basic check once a week on your endpoints.
Adding regions
Postman can automatically select a region where your Monitor will run, or you can manually select one or more regions. This is helpful if you want to monitor API health or performance across multiple geographic regions.
Using static IPs
Static IPs are available on Postman Professional, and Enterprise plans when you manually select a region. This option lets you securely monitor private APIs using a direct channel to Postman.
Getting monitor notifications
When configuring a monitor, you can choose to receive email notifications for monitor run failures and errors. You can also add other email recipients to receive notifications.
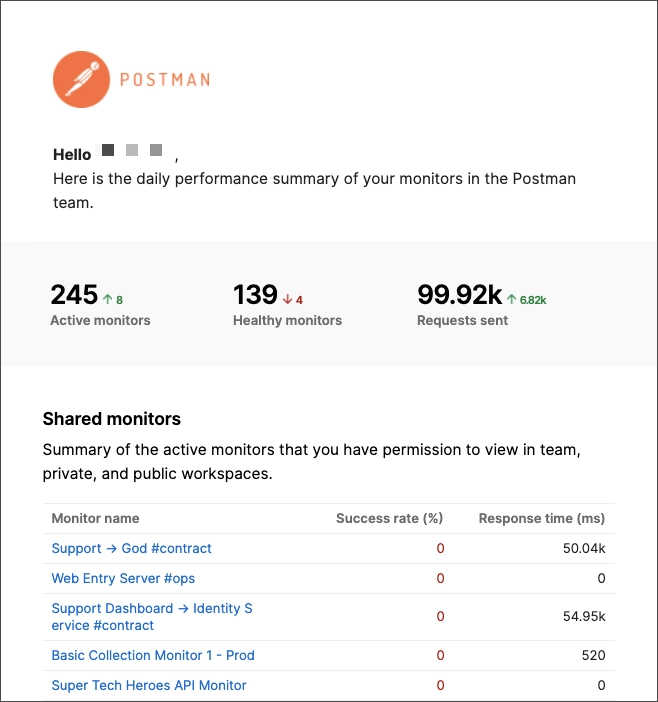
You will receive daily and weekly summaries of your active monitors by email. If you want to opt-out of daily or weekly summaries, select the Postman header's notifications icon and Manage Preferences.
Page showing daily performance summary of monitors
Using Retry on failure
Select the Retry if run fails an option to rerun a monitor after a failure or error. If this option is enabled, Postman will automatically run the failed request again. This can help to avoid false alarms due to transient issues. Postman will log the initial failure and will alert you if the run continues to fail.
Adding request timeouts
You can choose to Set request timeout if you'd like to make sure all of your requests run within a certain amount of time. Each Monitor run default has a timeout of 10 minutes (Postman Free plans) or 15 minutes (Postman Basic, Professional, and Enterprise plans). These timeout values apply to the entire monitor run, including all HTTP requests, responses, pre-request, and test scripts.
Adding delays between requests
Enabling Set delay between requests will insert a delay between all requests in your Collection. To configure the delay for individual requests, you can add a delay in your pre-request or test scripts using setTimeout().
For Postman Free plans, the delay between requests can't exceed 10 minutes (600000 ms). For Postman Basic, Professional, and Enterprise plans, the delay between requests can't exceed 15 minutes (900000 ms). Note that these values are the same as the maximum runtime for a monitor.
Managing redirect behavior
Select Follow redirects to enable URL redirection for requests run by the Monitor.
Disabling SSL validation
The Enable SSL validation option is selected by default. You can turn off SSL validation if you are using self-signed certificates and want to stop the validations of SSL certificates.
Viewing collection-based monitor results
Collection-based monitors continuously track the health and performance of your APIs. With Postman, you can stay up to date on what's happening across all collection-based monitors in your workspace. Or you can dive into individual monitors to examine test results and performance over time.
Viewing monitors in Postman
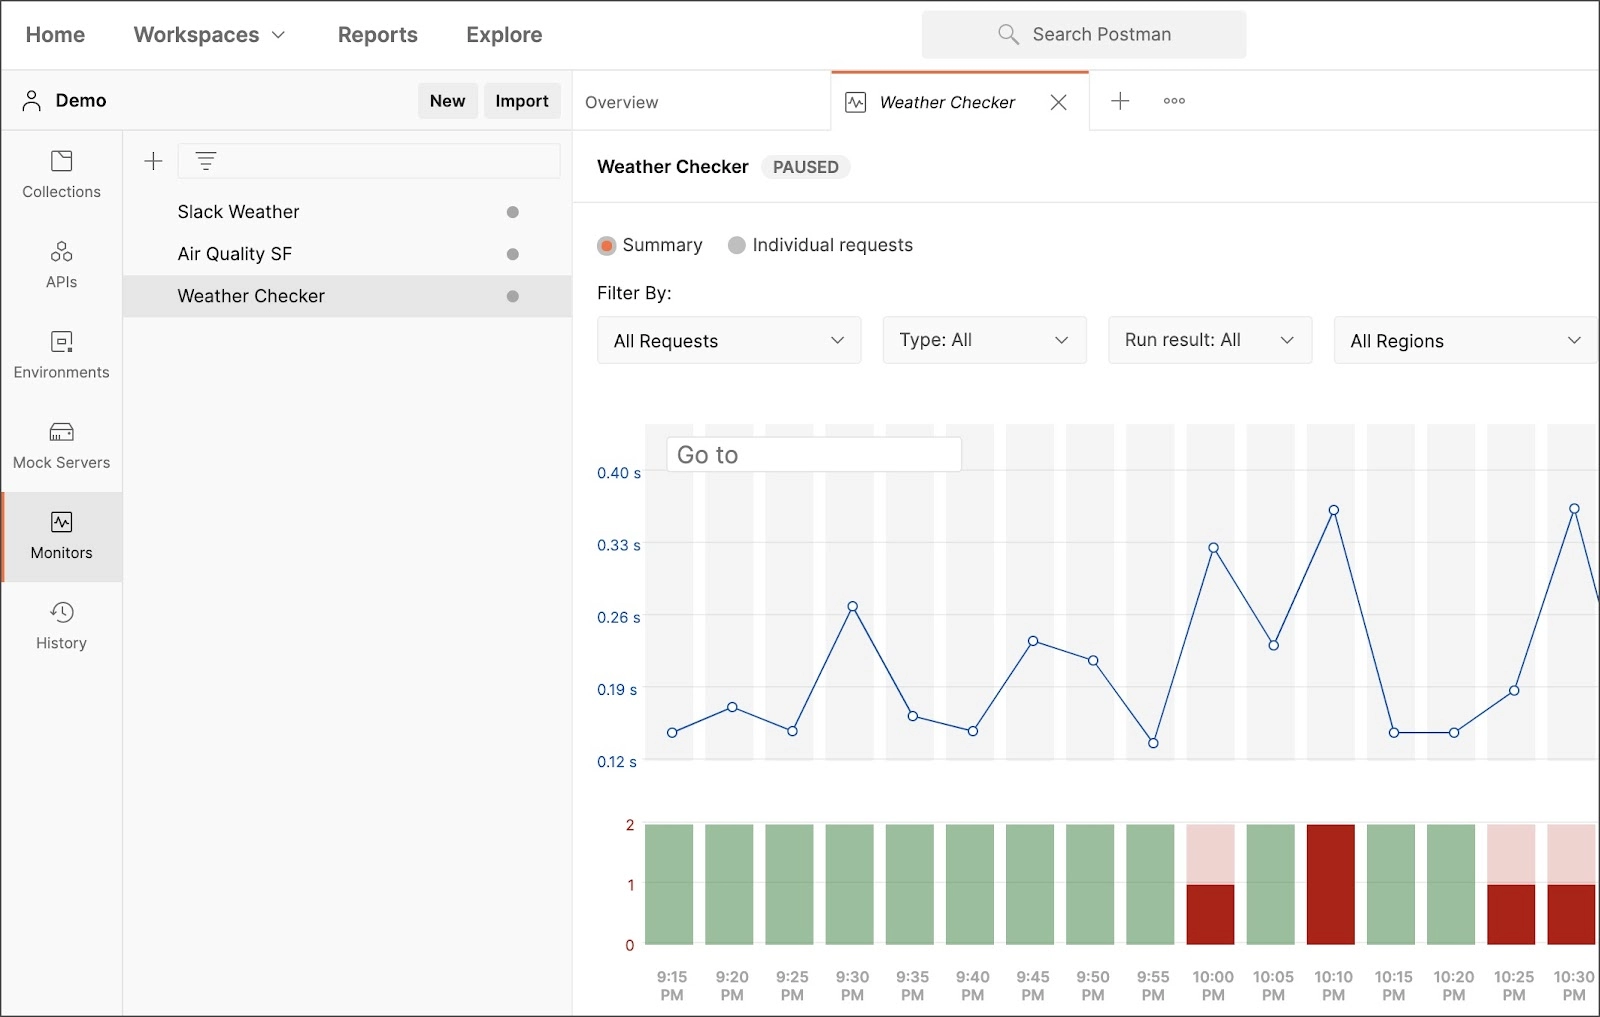
You can view your collection-based monitors in Postman by navigating to your workspace and selecting Monitors in the sidebar. Select your Monitor to open a tab detailing its latest performance.
Monitors in team workspaces are visible to all members of the workspace.
Monitor summary
You can use the Monitor Summary to understand how your APIs have performed over time. Each monitor run is represented by a bar in the graph.
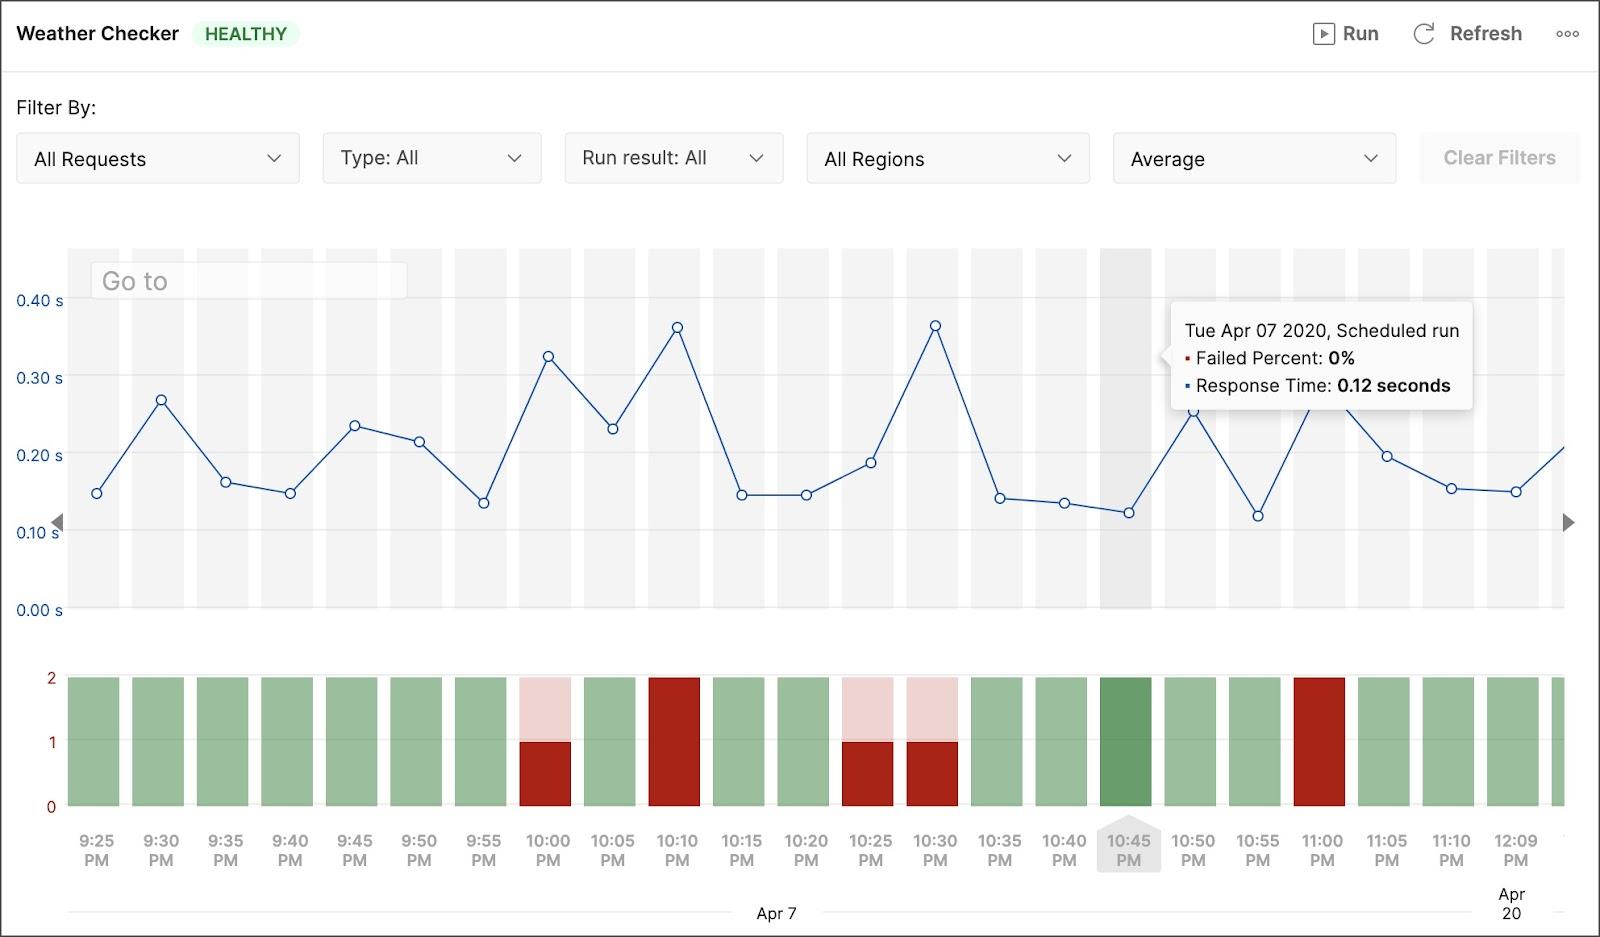
The upper section charts your Monitor's average response time for each run, while the lower section visualizes the number of failed tests across all regions. To view the exact values for failed percentage and response time, hover over each run individually.
A red bar indicates that either test failed or errors occurred during the run.
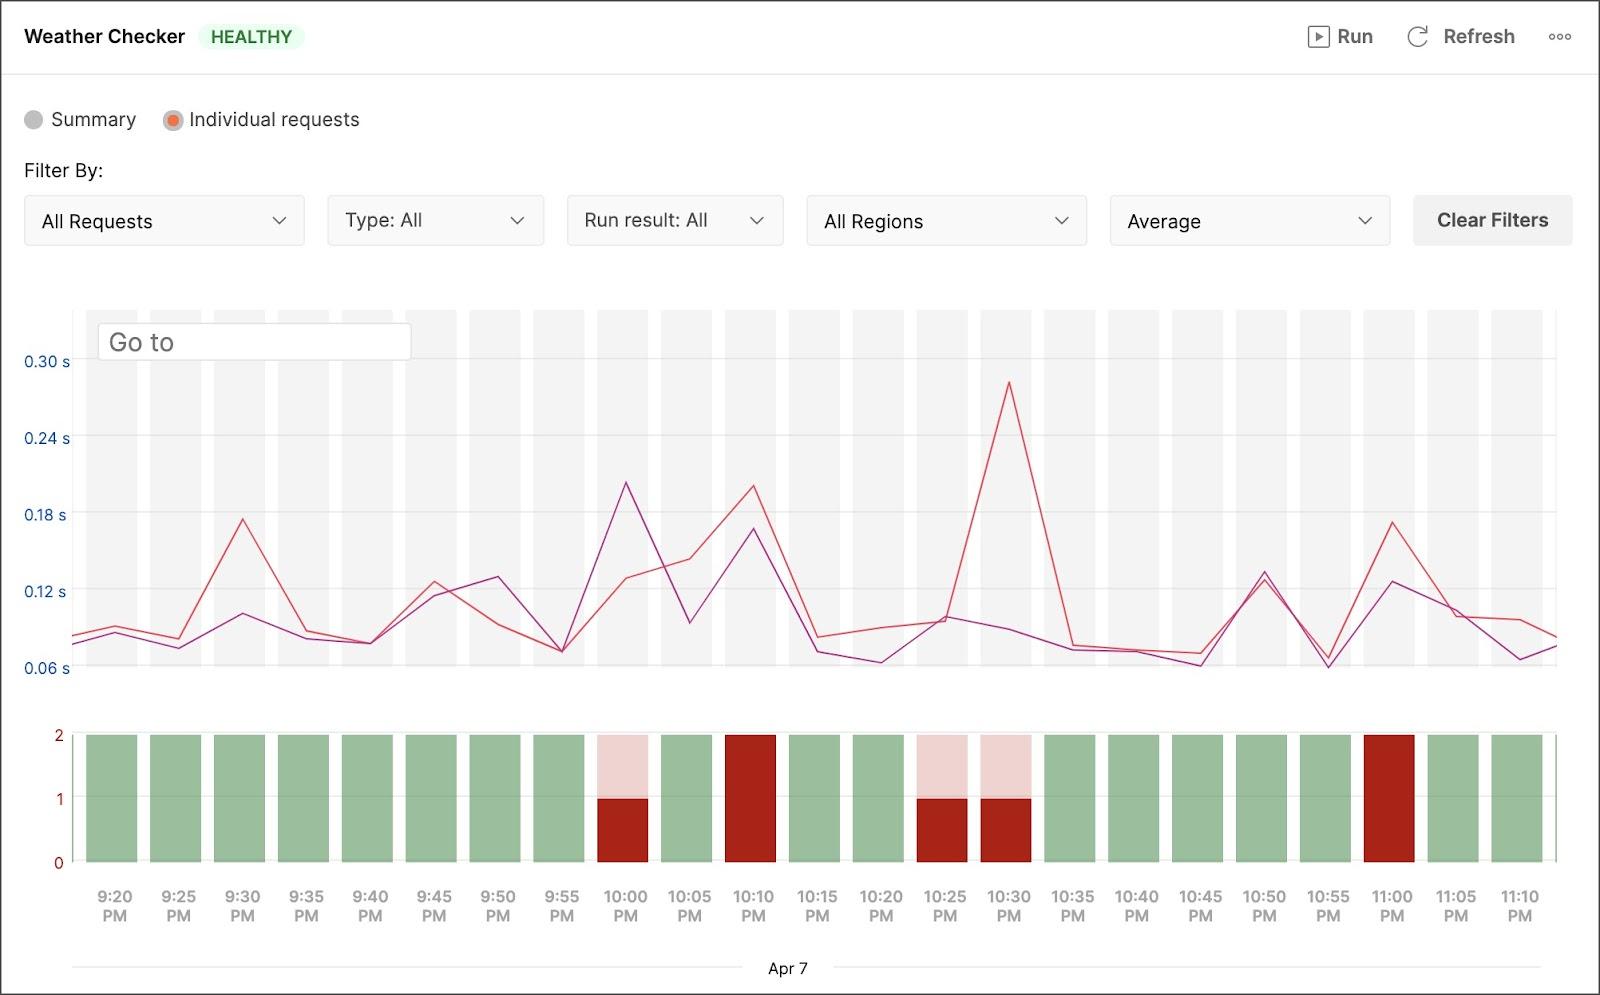
Individual requests
You can select Individual requests to break down your monitor summary into separate requests.
Selecting Individual requests to break down the monitor summary
Filters
You can use filters to identify recurring patterns in your monitoring runs by selecting particular requests, run types, results, and regions (if applicable).
You can Clear Filters to return to your original dashboard view.
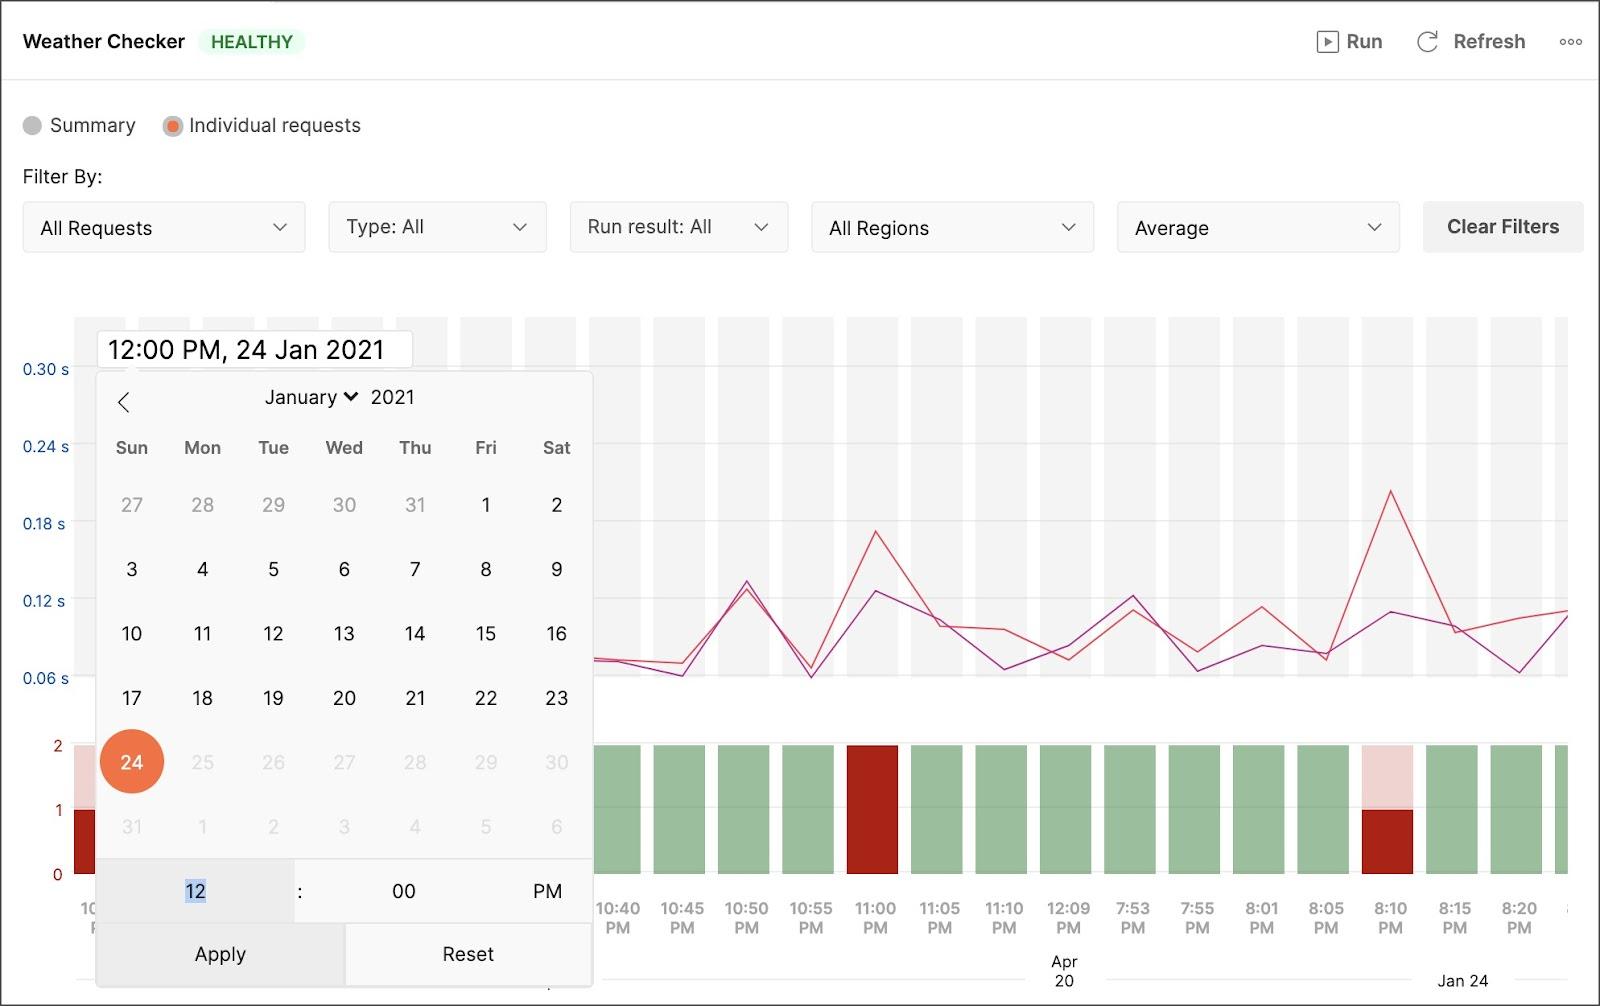
Time traverse
You can review past run results to understand what happened at a particular time. To do so, select Go in the upper-left corner of the monitor summary or request a split graph. Select the time and date, then select Apply to view a specific run.
Selecting time and date
To revert the view to your most recent runs, select the time and date you defined in the upper-left corner of the graph, then select Reset.
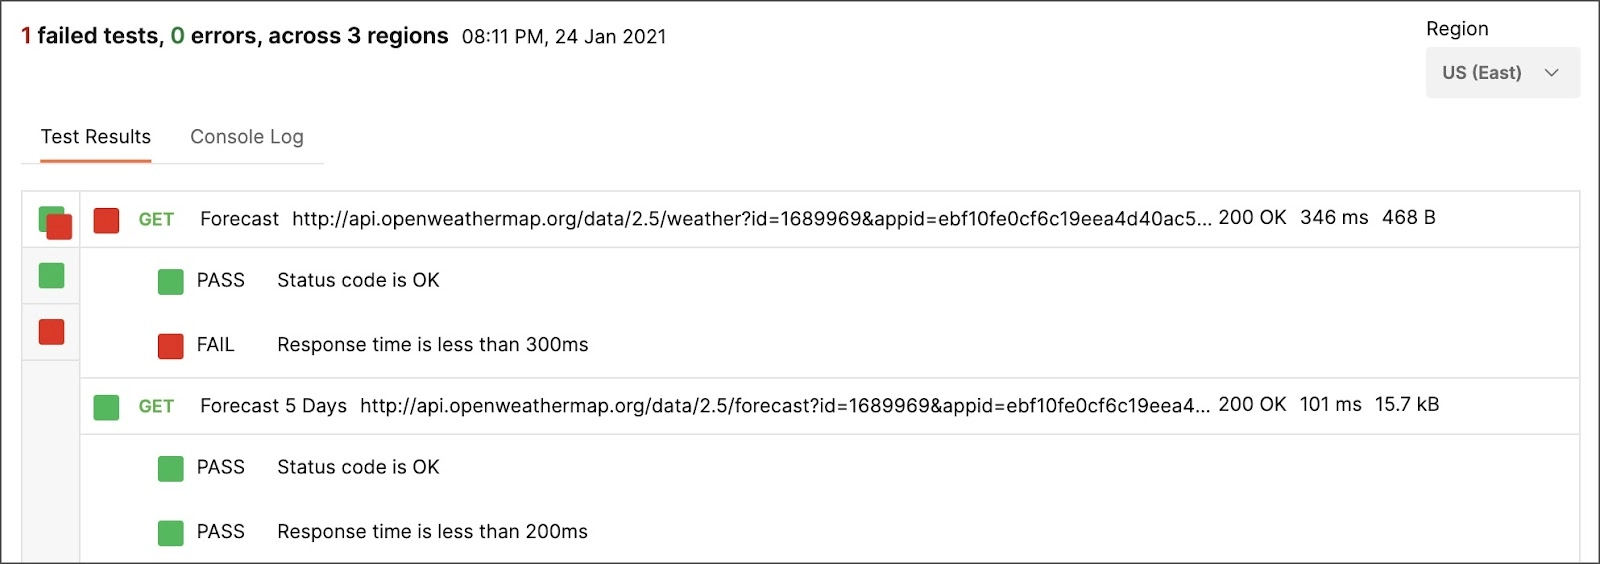
Test results
Select Test Results to get more detailed information on your tests, including which passed or failed, the response codes, and the response times.
A page showing the test results
If your Monitor is configured to run in multiple regions, you can view the test results for a particular region by selecting it from Region.
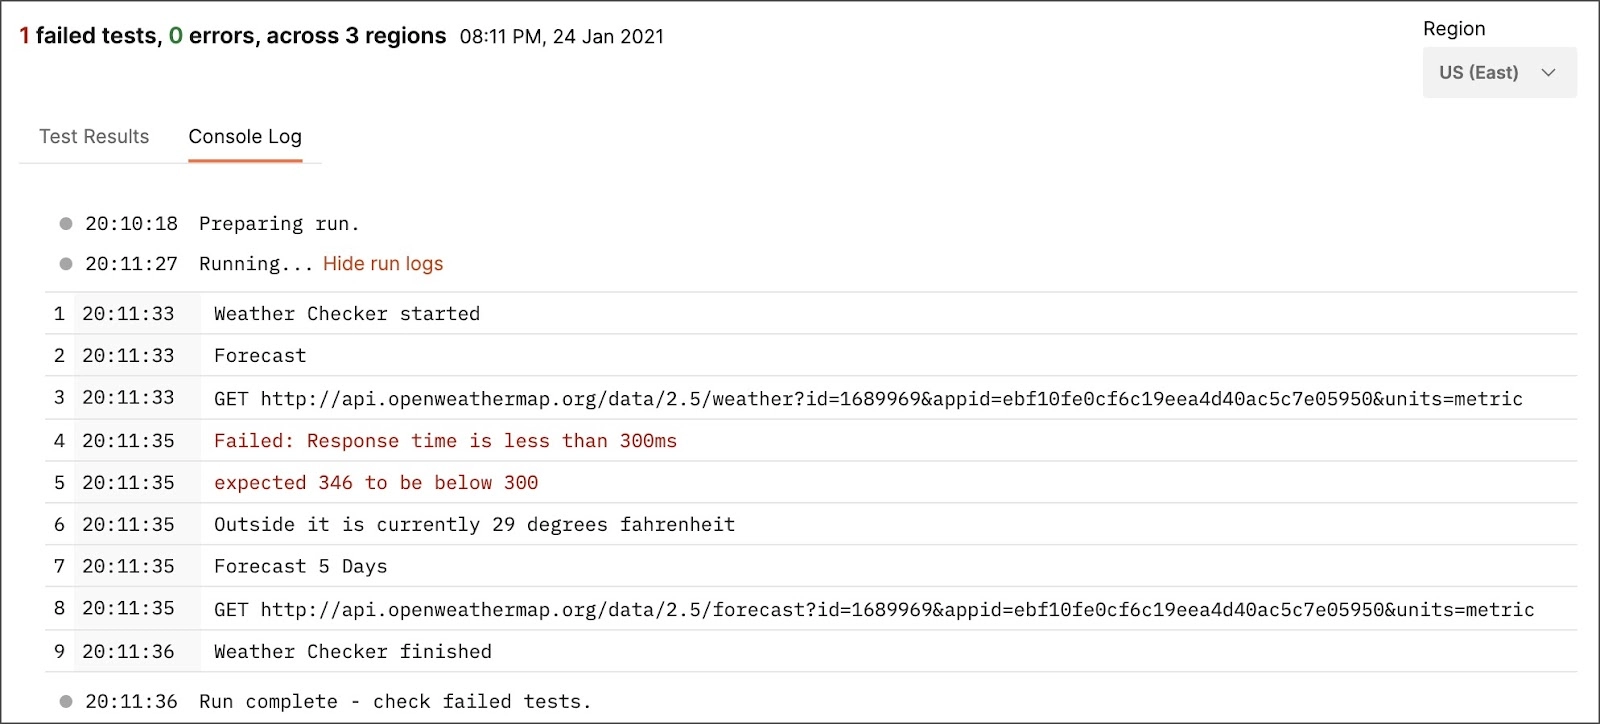
Console log
Select Console Log to view monitor run details along with the console.log statements that run as part of your pre-request and test scripts. Run details specify the various stages of a monitor run, such as preparing run, running, rerunning, and the run result, along with error and test failure information. Selecting a request in the Console Log will open it in a tab, allowing you to review and edit the request as needed.
If your Monitor is configured to run in multiple regions, you can view the console logs for a particular region by selecting it from Region.
You can use this console to troubleshoot issues and learn more about an individual run's behavior.
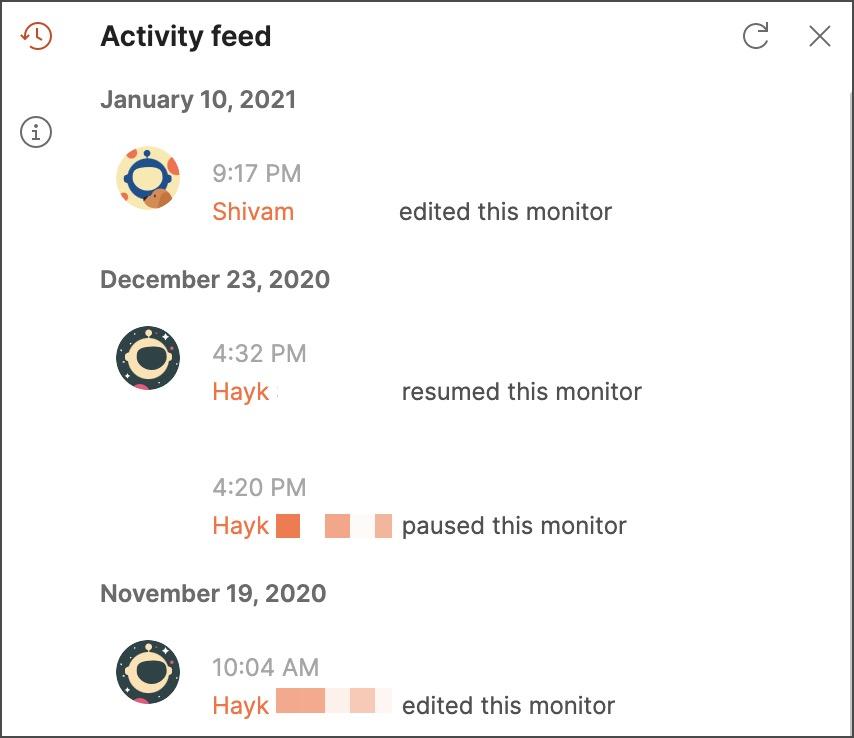
Activity log
You can view a monitor's activity logs by selecting the changelog icon in the upper-right corner > View activity logs.
The activity feeds view page.
You can check these logs to learn when a monitor was created, edited, paused, or resumed running and which team member performed each action.
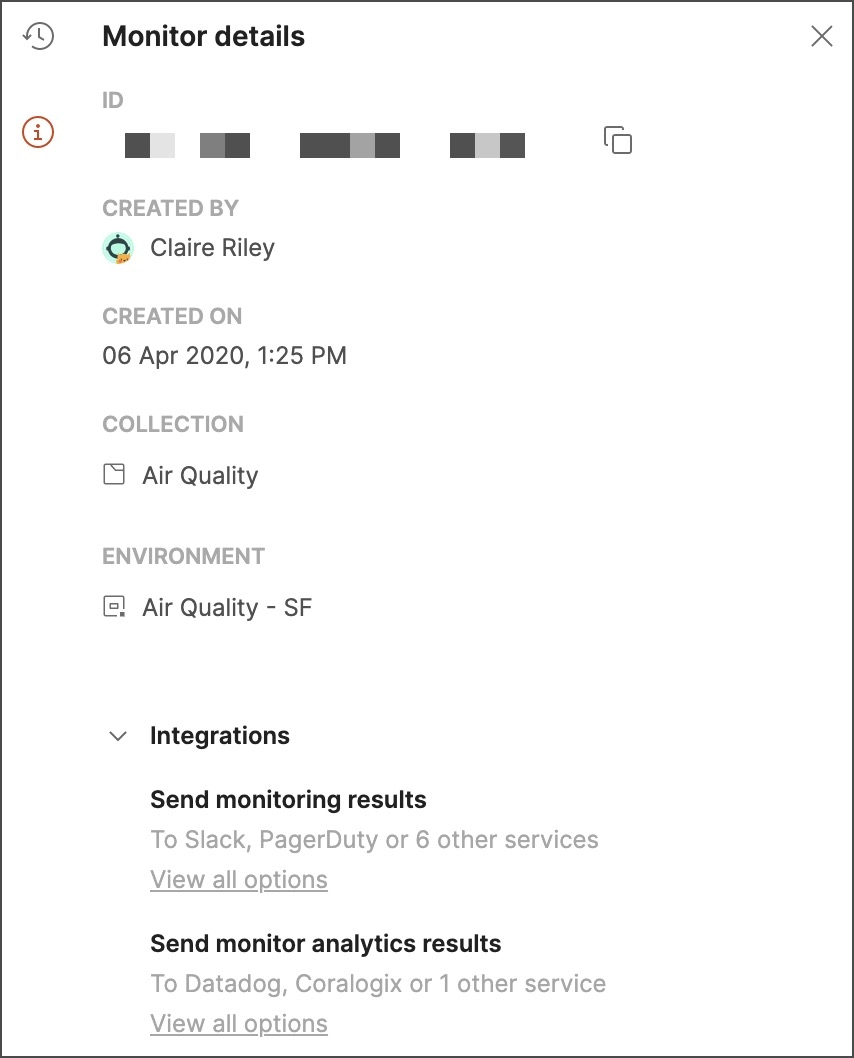
Monitor details
You can view details about a monitor by selecting the information icon in the upper-right corner. Here you can view a monitor's ID, creator, creation date and time, Collection, environment, and integration options.
A page view of monitor details
Frequently Asked Questions
What is a collection in Postman?
In Postman, a collection is used to group related requests. It facilitates organizing requests into folders in a systematic manner.
What kinds of requests can you make with Postman?
Request Method, Request URL, Request Headers, Request Body, Pre-request Script, and Tests are all included in an HTTP request method.
What does Postman's endpoint mean?
You may include Postman in your development toolchain by integrating it with the Postman API endpoints. Through the API, you can add and run monitors, update environments, add and run new collections, and update existing collections. You can now access data kept in your Postman account programmatically.
What does Postman's Collection mean?
A collection of saved requests is called a Postman Collection. Every request you make in Postman is recorded in the sidebar's History tab.
Conclusion
We hope this blog has helped you enhance your Knowledge about Postman and how to use Postman to set up and view a collection-based monitor.
If you think you are ready for the tech giants company, check out the mock test series on code studio.
You can also refer to our Guided Path on Coding Ninjas Studio to upskill yourself in domains like Data Structures and Algorithms, Competitive Programming, Aptitude, and many more! You can also prepare for tech giants companies like Amazon, Microsoft, Uber, etc., by looking for the questions asked by them in recent interviews. If you want to prepare for placements, refer to the interview bundle. If you are nervous about your interviews, you can see interview experiences to get ideas about these companies' questions.
Nevertheless, you may consider our premium courses to give your career an edge over others!
Do upvote our blogs if you find them helpful and engaging!


 8+ registered

