Do you think IIT Guwahati certified course can help you in your career?
Skewness
The concept of Skewness is based on humans' way of thinking. For example, when we look at some charts, our minds intuitively derive the pattern in that chart. Skewness is a fundamental statistical concept that everyone in Data Science and analytics needs to know.
Introduction
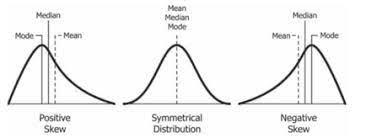
Skewness is the degree of asymmetry present in an ideally symmetric probability distribution that deviates from a given data set's symmetrical normal distribution (bell curve). Now, what's a normal distribution? The normal distribution is a probability distribution without any deviation or Skewness. The normal distribution helps us to find the extend of Skewness. A normal distribution has nearly zero Skewness, i.e., the mean, median, and mode lie on the same line.
Note: As mentioned earlier, the symmetric distribution has nearly zero Skewness because, in reality, no real word data has a perfectly normal distribution. So, the value of Skewness is not precisely zero; it is tending to zero or nearly zero. We use the value of zero as a reference for determining the Skewness of a distribution.
In a symmetrical distribution, the left side contains the same number of observations as the right, but when it is not symmetrical, Skewness occurs. The tail is towards the right side in positive Skewness, while the left side is negatively skewed.
The linear models assume that the distribution of the independent variable and the dependent(target) variable are similar. Thus, knowing the Skewness of data helps us in creating better models.
Suppose we have positively skewed distributed data. So that means it has a higher number of data points having low values or lower data points towards a higher number of values. So during the model training on this type of data, it will perform better at predicting lower values than those with higher values.
Skewness helps us know the direction of outliers. In the case of a positively skewed distribution, most outliers are present on the right side of the distribution. In contrast, most outliers are present on the left side of the distribution in the case of negatively skewed data. Skewness does not tell us about the frequency of outliers. It just tells us the direction.
Now that we have seen Skewness's importance let us look into different Skewness types.
Types Of Skewness
Positively Skewed Distribution
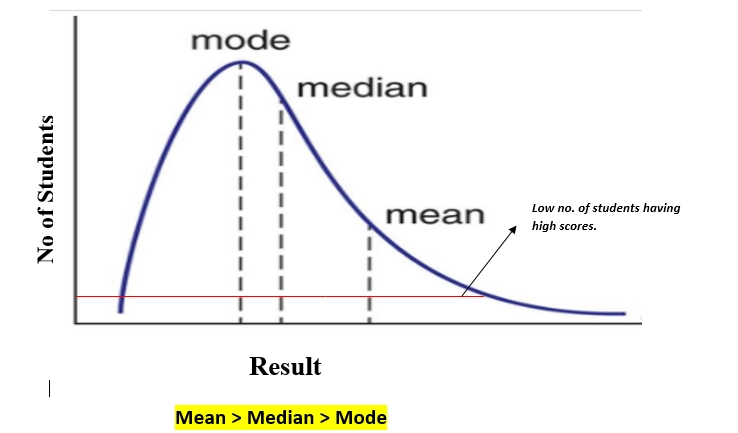
In a positively skewed distribution, the measure of central tendency are dispersed,i.e., the mean, median, and mode of the distribution are somewhat positive than negative or nearly zero. There will be a few observations at a higher value of inputs.
In a positively skewed distribution, the mean of the data is greater than the median. The mean of the distribution will be more than the median, and the mode is always the highest value.
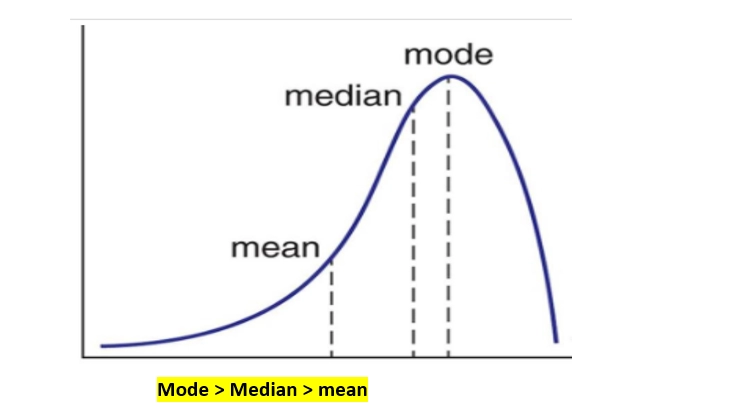
Negative skewed is just the opposite of positive skewed. In a negatively skewed distribution, the measure of central tendency are dispersed,i.e., the mean, median, and mode of the distribution are rather negative than positive or nearly zero. There will be a few observations at a lower value of inputs.
In a negatively skewed distribution, the mean of the data is lower than the median. The mean of the distribution will be less than the median, and the mode is always the highest value.
So far, we have seen the negative impact of skewed data that can affect our machine learning model's predicting capabilities. So for better results, it is for our good to change the skewed distributed data to normally distributed data. Some of the methods to transform our skewed distributed data are:
Power Transformation
Exponential Transformation
Log Transformation
Skewness Coefficient
As we know, the higher the skewness higher is the measure of central tendency. So, the measure of Skewness can be written as:
Skewness = mean - mode
standard deviation
We divide the difference by standard deviation to enable the distribution among distributions on the same scale.
The mode calculation for the central tendency for small data or multiple modes is not recommended, so we will replace mode in terms of the median and the mean to arrive at a more concentrated formula.
Mode = 3(Mean) - 2(Mode)
Replacing the value of mode in the above skewness equation we get,
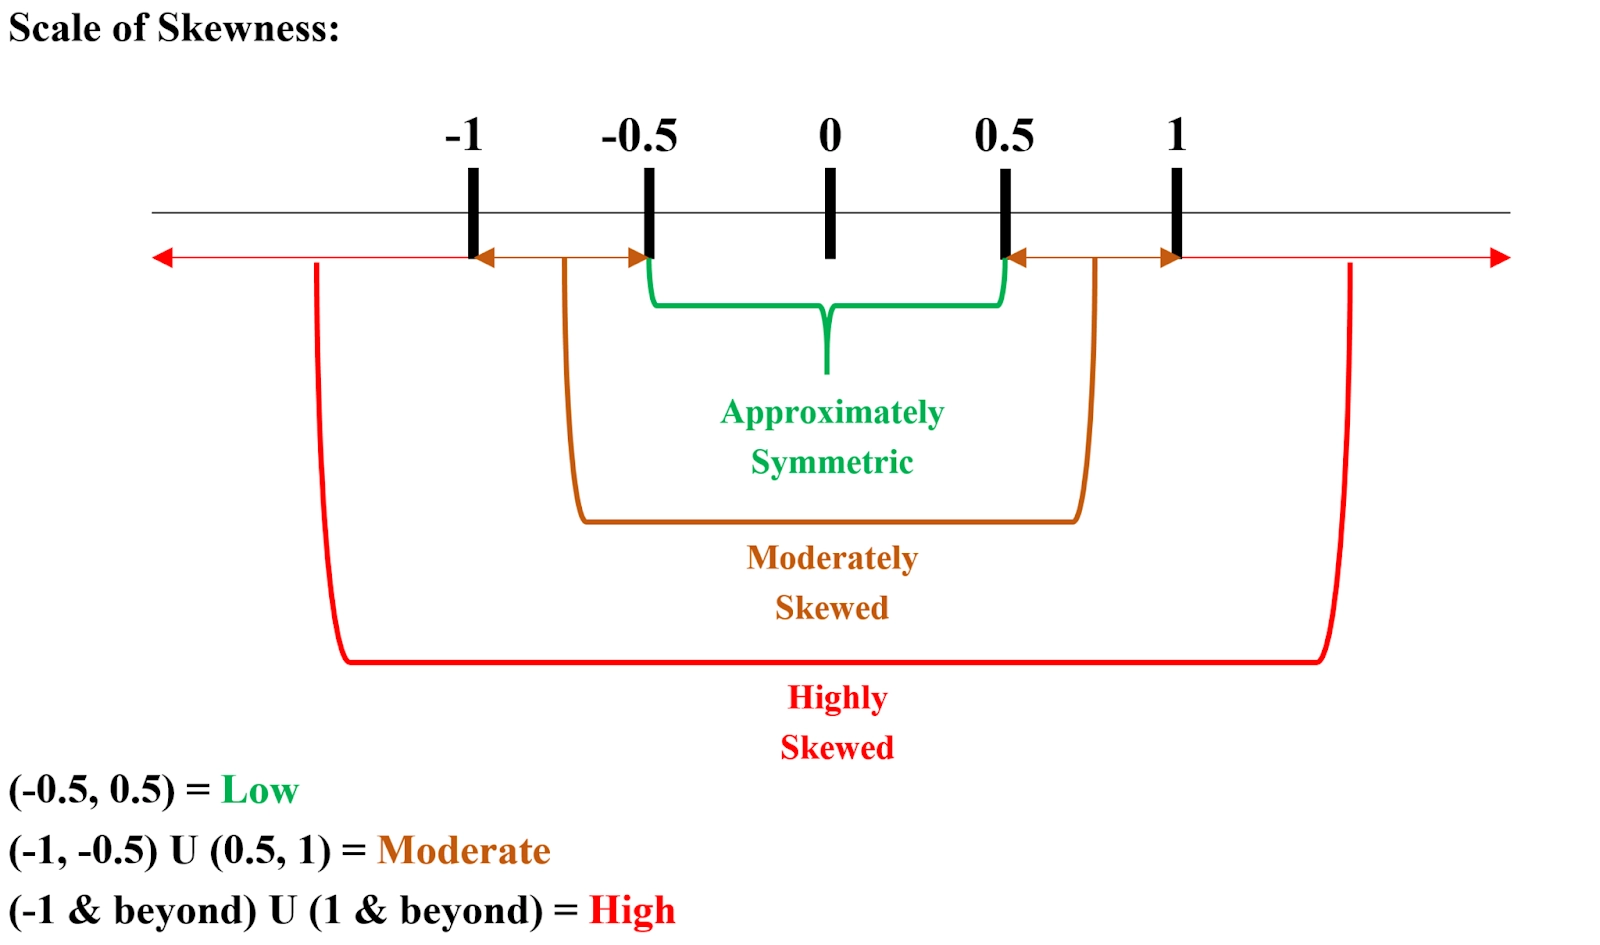
The data is nearly symmetrical if the Skewness lies between -0.5 & 0.5.
The data is extremely skewed if the Skewness is lower than -1 or greater than 1.
If the Skewness lies between -1 & -0.5 or between 0.5 & 1, the data is slightly skewed.
Kurtosis
According to statistics, kurtosis measures the "tailedness," i.e., heavy-tailed or light-tailed, of the probability distribution of a real-valued variable. Kurtosis describes the shape of the probability distribution.
Excess Kurtosis
Excess kurtosis is used to compare the kurtosis coefficient with that normal distribution. Excess kurtosis can be positive, negative, or near zero. As we know, the normal distributions have a kurtosis of 3. Excess kurtosis is calculated by subtracting by 3.
Excess kurtosis = Kurt – 3
Types of excess kurtosis:
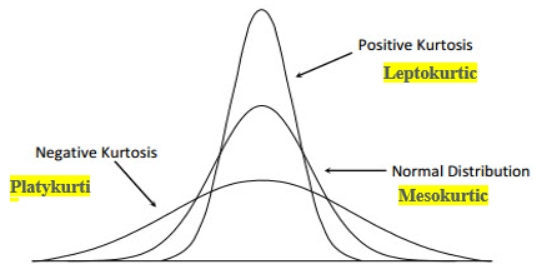
Leptokurtic or heavy-tailed distribution
Kurtosis is more than the normal distribution. They are more prone to outliers,
having long skinny tails. The distribution is peaked and has thick tails. An
extreme positive kurtosis indicates a distribution where numbers are more
located in the distribution's tails instead of the mean.
Mesokurtic
Kurtosis same as the normal distribution,i.e., kurtosis equals three. The
distributions are moderate in breadth and medium peaked height of the
curves.
Platykurtic or short-tailed distribution
Kurtosis is less than the normal distribution. The data points are located in
the proximity of the mean, having lower tails. The distribution is less peaked.
Why is kurtosis of the normal distribution three? Kurtosis measures the degree of tailedness in the frequency distribution. In contrast, Skewness is measured lack of symmetry, i.e., both left and right sides of the curve are unequal, concerning the central point.
Why kurtosis of the normal distribution is three? The sample kurtosis corresponds to the mean fourth power of a standardized set of sample values. As we know, this fourth standardized moment is three in the case of a normal distribution.
How do skewness and kurtosis affect the normality of data? Statistically, two numerical measures of shape – Skewness and excess kurtosis can be used to test for normality. Normality tests determine whether a data set is designed for normal distribution.
Key Takeaways
Let us brief the article.
Firstly, we saw Skewness, their importance, and their types, and how we can transform skewed data into standard form with different types of distribution. Finally, in Skewness, we saw a scale of Skewness. Further, we saw kurtosis and its various types.
Thus, from the above, we can say that the Skewness captures the horizontal push or pull distortion on a normal distribution curve, and the Kurtosis measure captures the vertical push or pull distortion.
I hope you find this article helpful. Stay updated for further exciting articles.


 9+ registered

