Using Slicers
Execute the procedures below to insert a slicer.
Any cell in the pivot table can be selected by clicking it.
Click Insert Slicer in the Filter group on the Analyze tab.

Check the Country box and then click OK.

To see which products we export the most to the United States, go to the United States.

Finally, bananas are our primary export to the United States. The United States is selected as the report filter (cell B1).
OK, that was pretty easy. Let's insert a second slicer.
Click any cell inside the pivot table.
On the Analyze tab, in the Filter group, click Insert Slicer.

Check Product and click OK.

Select the slicer.
Select a slicer style from the Slicer Styles group on the Options tab.

The second slicer should be used. To pick multiple products, use the Multi-Select button.
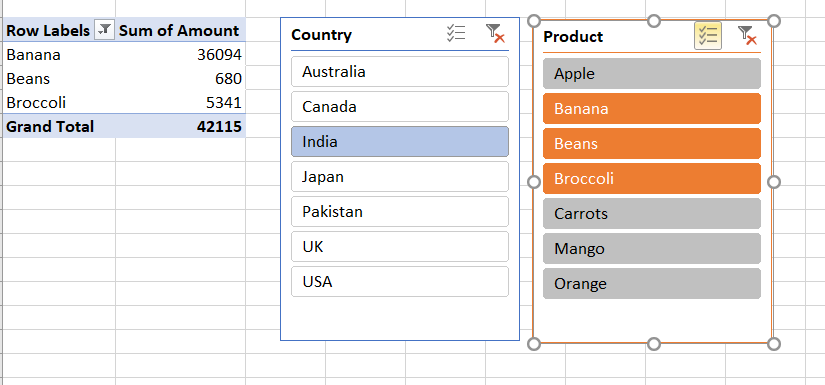
To choose numerous things, hold down CTRL instead of the Multi-Select button.
Execute the following procedures to truly impress your manager.
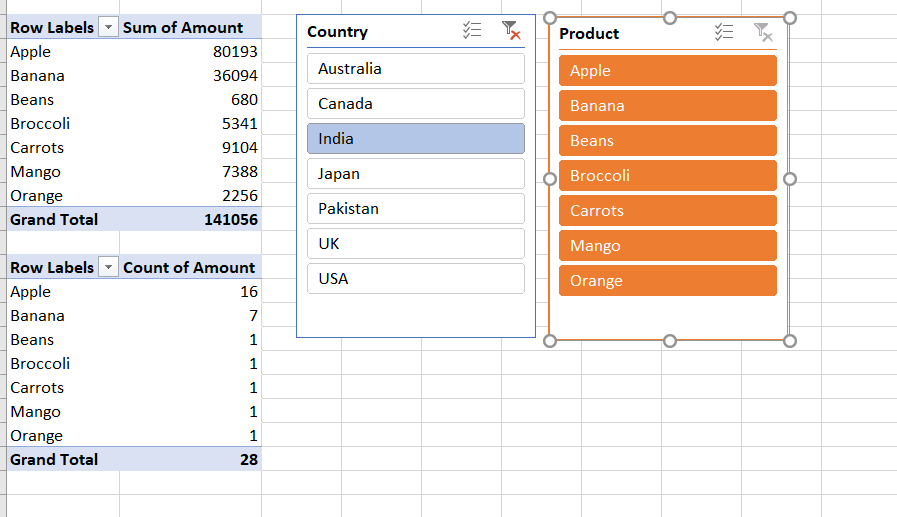
Add a second pivot table to the mix.
Execute the steps below to connect both slicers to this pivot table.
The first slicer should be chosen.
Click Report Connections in the Slicer group on the Options tab.

Click OK after selecting the second pivot table.

Repeat steps 12-14 for the second slicer.
Use both slicers.

Conclusion: The total value of bananas sold to India is $36,094 (7 orders).
To clear the filter, click the icon in the upper-right corner of the slicer.
Timelines in Excel
Timelines are like slicers. They allow you to filter your data using a visual interface, but they are specifically for use with date fields.
They allow you to easily filter on ranges of dates by days, months, quarters or years. The dates appear in a horizontal line going from oldest to newest as you go from left to right on the timeline.
Timelines are only available for use with date fields in PivotTables.
Using Timelines
The PivotTable Tools ribbon appears when you click anywhere on the Pivot table.
Insert Timelines may be found under PivotTable Tools -> Analyze -> Insert Timelines.

Select Insert Timeline from the drop-down menu.
The Insert Timeline window will display, showing only the date column of your table. Check the box next to the date.

Select OK.
As illustrated below, the chronology will be displayed on the worksheet.

Hence, In this article we learned the concept of slicers and timelines. We also saw how to practice working with slicers and timelines.
FAQs
1. What is a slicer in the Excel Pivot table?
Slicers are filters with buttons that will allow us to perform quick filtering on Excel tables or Pivot tables and get the desired output in fewer clicks.
2. How does slicer work in Excel?
For the Excel Pivot table, you can insert the slicer from Analyze -> Insert Slicer.
For regular excel tables, you have to go to Insert -> Slicer
3. How do we connect slicer to pivot tables?
To connect a slicer to pivot tables:
- Click on the Slicer you want to connect to the tables.
- Go to Slicer Tools -> Report Connections.
- From the dialogue, you can choose the tables which are to be connected with that particular slicer.
4. How do we make a horizontal slicer in Excel?
The default setting of a slicer is by columns, and you can change it using the Slicer Tools Options.
Select the slicer, Go to Slicer Tools -> Options.
Under the Buttons section, you can change the number of columns, their height, and their width. This way you can customize the slicer to display as horizontal, vertical, or any other format as you desire.
5. What is the difference between Slicer and Timeline?
Slicer lets you filter the pivot table or regular table effectively. You can filter based on different fields.
Timelines are only used to filter based on the date field in a table like a month, year quarter, etc. If you don’t have a date field in a table then you will get an error.
Key Takeaways
In this article, we learned about pivot tables in excel. We also learned about the concept of Slicers and Timelines in pivot tables. We also saw an example of how to use slicers and timelines in our pivot tables.
Apart from this, you can also expand your knowledge by referring to the blog- Introduction to Excel, Pivot Charts, and Group Pivot tables.
For more information, refer to Worksheets in Excel.
Refer to our guided paths on Coding Ninjas Studio to learn more about DSA, Competitive Programming, JavaScript, System Design, etc. Enroll in our courses and refer to the mock test and problems available; take a look at the interview experiences and interview bundle for placement preparations.
Do upvote our blog to help other ninjas grow.
Happy Learning!


 9+ registered

