Why do we need an actuator spring boot?
Spring Boot Actuator is an essential tool for monitoring and managing Spring Boot applications in production environments. There are many important reasons why it is needed and beneficial for developers and operations teams. Let's discuss those reasons :
1. Application Health Monitoring: The actuator endpoints, such as `/health`, allow you to check the health status of your application. It provides a quick way to determine if your application is up and running or if any issues need attention. By monitoring the health endpoint, you can proactively identify and address any problems before they impact the users.
2. Metrics and Performance Monitoring: The `/metrics` endpoint exposes various metrics and statistics about your application, such as memory usage, HTTP request count, and response times. These metrics help you understand how your application is performing and identify potential bottlenecks or performance issues. By collecting and analyzing these metrics, you can optimize your application's performance and ensure a better user experience.
3. Runtime Configuration Management: The `/env` endpoint allows you to view and modify the application's environment properties and configuration at runtime. This is particularly useful when you need to adjust configuration parameters without restarting the application. It provides flexibility and ease of management in production environments.
4. Logging and Tracing: The `/loggers` endpoint enables you to view and modify the application's logging configuration dynamically. You can change the log levels of specific packages or classes without the need to restart the application. Additionally, the `/trace` endpoint captures the most recent HTTP requests and their details, which can be valuable for debugging and troubleshooting purposes.
5. Integration with Monitoring Tools: Spring Boot Actuator integrates well with popular monitoring and management tools like Prometheus, Grafana, and ELK stack. By exposing metrics and other data through the actuator endpoints, you can easily collect and visualize the information in these tools. This integration enables centralized monitoring, alerting, and data analysis, making it easier to manage and maintain your applications.
6. Production Readiness: The actuator endpoints provide a standardized way to expose application information and management capabilities. By leveraging these endpoints, you can ensure that your application is production-ready and follows best practices for monitoring and management. It helps in building robust and maintainable applications that can be easily operated and supported in production environments.
7. Debugging and Troubleshooting: When issues arise in production, the actuator endpoints can be invaluable for debugging and troubleshooting. By accessing endpoints like `/trace`, `/loggers`, and `/dump`, developers can gather detailed information about the application's state, recent requests, and thread dumps. This information can help in identifying the root cause of problems and resolving them quickly.
Spring Boot Starter Actuator
Spring Boot Actuator provides secured endpoints for monitoring and managing the Spring Boot application. By default, all actuator endpoints are secured. It provides several additional features that help us monitor and manage the Spring Boot application. It contains the actuator endpoints.
With the help of actuator endpoints such as HTTP and JMX, we can manage and monitor the spring boot applications.
To enable the production-ready features into your application, you can use Starter Actuator.
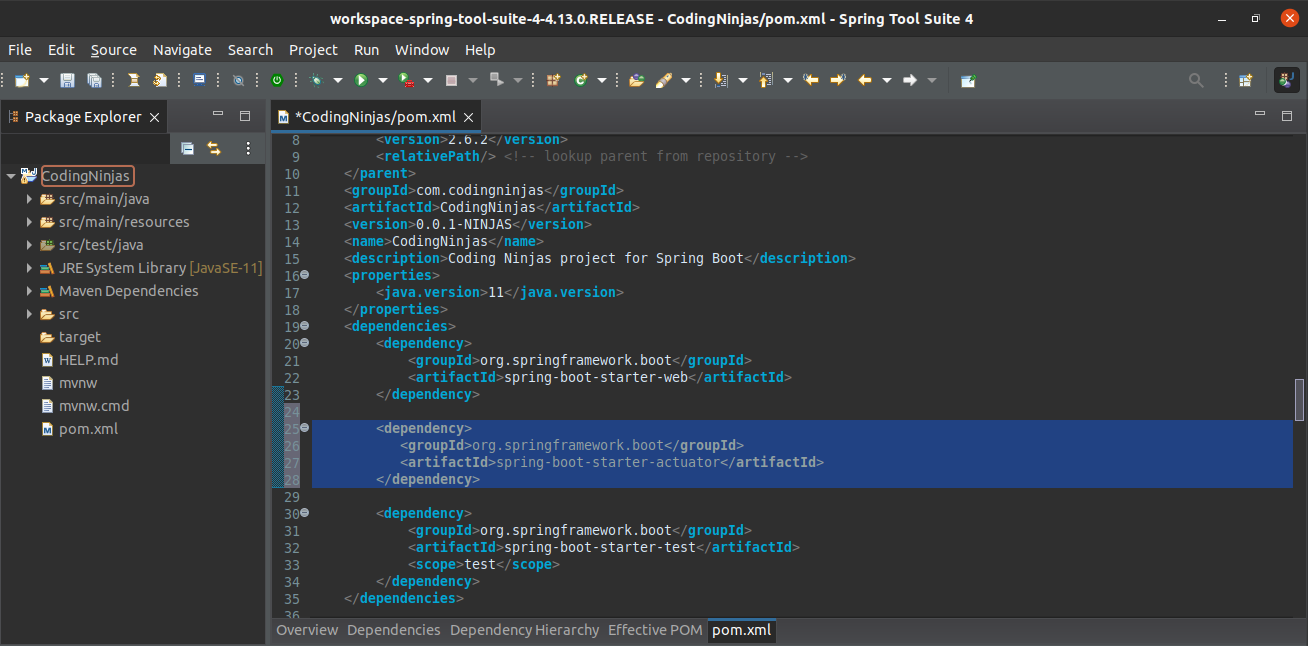
To enable Spring Boot Actuator into our Spring Boot application, we need to add spring-boot-starter-actuator dependency in the pom.xml file.
<dependency>
  <groupId>org.springframework.boot</groupId>
  <artifactId>spring-boot-starter-actuator</artifactId>
</dependency>

You can also try this code with Online Java Compiler
You can see we have added this dependency into our pom.xml in the following picture:
Let’s now discuss some of the features of the Spring Boot Actuator.
Features of Spring Boot Actuator
There are three main features of the Actuator:
1.) Endpoints
2.) Metrics
3.) Audit
Let’s learn about these features.
Endpoints:
The actuator endpoints will allow us to monitor and interact with the application. Spring Boot provides several built-in endpoints. We can also create our own endpoint. Most of the applications choose HTTP, where the Id of the endpoint, along with the prefix of /actuator, is mapped to a URL.
For example, the /env endpoint is used to expose properties from Spring's ConfigurableEnvironment. By default, the actuator is mapped to it like this /actuator/env.
Metrics:
Spring Boot Actuator provides metrics by integrating with the micrometer. The micrometer is integrated into Spring Boot. A micrometer is a vendor-neutral metrics facade, meaning metrics can be collected in one way but revealed in the format required by many different monitoring systems.
Audit:
Spring Boot provides an audit framework that produces events to an AuditEventRepository. It involuntarily publishes the authentication events if spring-security is in execution.
Spring Boot Actuator Endpoints
The actuator endpoints allow us to monitor and interact with the spring boot application. Spring Boot provides several built-in endpoints. We can also create our own endpoint.
Some of the most widely used endpoints are mentioned below:
1.) /metric: It is used to view the application metrics such as memory used, memory-free, threads, system uptime, etc.
2.) /env: It is used to view the list of Environment variables used in the application.
3.) /health: It is used to show the health of the application.
4.) /info: It is used to view the information about the Spring Boot application.
5.) /trace: It is used to view the list of Traces of your rest endpoints.
6.) /beans: It is used to show the complete list of all the Spring beans in your application.
Enabling Spring Boot Actuator
In this blog, we will fetch two endpoints to show how the endpoints work and have that idea; you can easily implement other endpoints.
Before you start fetching the endpoints make sure that you have injected the spring-boot-starter-actuator dependency into your pom.xml file.
<dependency>
  <groupId>org.springframework.boot</groupId>
  <artifactId>spring-boot-starter-actuator</artifactId>
</dependency>
You can also try this code with Online Java Compiler
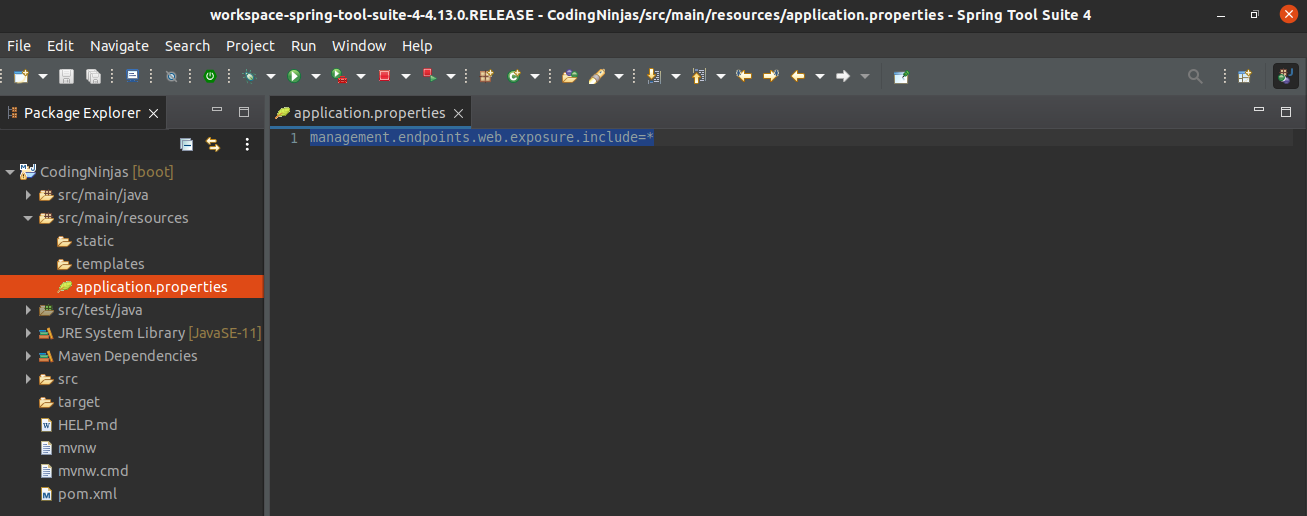
Note: All actuators other than /health are disabled by default for security purposes. You can use the management.endpoints.web.exposure.include property to enable the actuators.
Set management.endpoints.web.exposure.include = * in the application.properties file. This will enable all the actuator endpoints, even the most sensitive endpoints also (e.g /env, /beans, etc.).
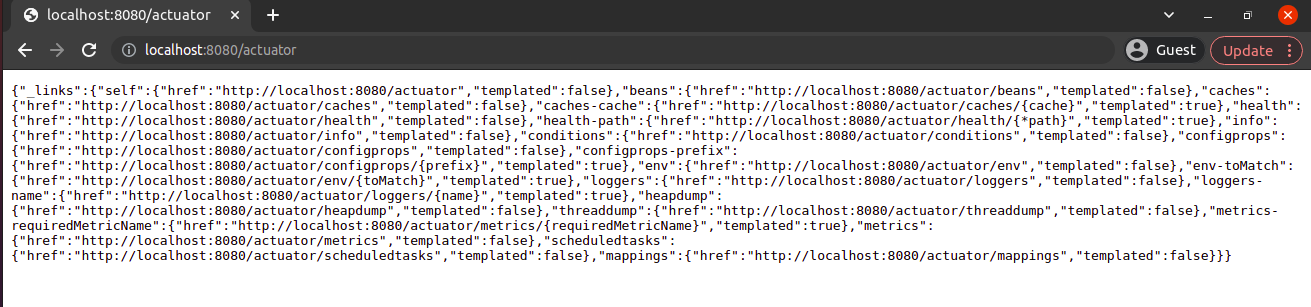
Run the <Application>.java file, open the browser, and invoke the URL http://localhost:8080/actuator. It will return the following page:
Fetching the /health Endpoint:
/health endpoint is used to show the health of the application.
Go to the browser and invoke the URL http://localhost:8080/actuator/health. It will return the following page:
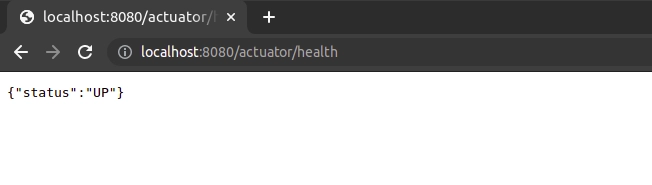
It shows the status UP, which means the application is healthy and running without any problem.
Fetching the /beans Endpoint:
/beans is used to show the complete list of all the Spring beans in your application.
Go to the browser and invoke the URL http://localhost:8080/actuator/beans. It will return the following page:

Spring Boot actuator properties
Spring Boot Actuator provides a wide range of configuration properties that allow you to customize and control the behavior of the actuator endpoints. These properties are defined in the `application.properties` or `application.yml` file of your Spring Boot application.
Let's see some commonly used Spring Boot Actuator properties:
1. `management.endpoints.web.exposure.include`: This property specifies which actuator endpoints should be exposed over HTTP. By default, only the `/health` endpoint is exposed. You can set this property to `*` to expose all endpoints or provide a comma-separated list of specific endpoints you want to expose.
2. `management.endpoints.web.base-path`: This property sets the base path for the actuator endpoints. By default, it is set to `/actuator`. For example, if you set this property to `/mgmt`, the health endpoint would be accessible at `/mgmt/health`.
3. `management.endpoint.<endpoint-name>.enabled`: This property allows you to enable or disable specific actuator endpoints. For example, `management.endpoint.health.enabled=true` enables the health endpoint.
4. `management.endpoint.<endpoint-name>.cache.time-to-live`: This property sets the cache time-to-live duration for the response of a specific endpoint. It is useful for endpoints that may have expensive computations. For example, `management.endpoint.health.cache.time-to-live=10s` sets the cache TTL for the health endpoint to 10 seconds.
5. `management.health.defaults.enabled`: This property controls whether the default health indicators should be enabled. By default, it is set to `true`. You can set it to `false` to disable the default health indicators.
6. `management.health.<indicator-name>.enabled`: This property allows you to enable or disable specific health indicators. For example, `management.health.db.enabled=false` disables the database health indicator.
7. `management.info.<property-name>`: This property allows you to customize the information displayed by the `/info` endpoint. You can define arbitrary key-value pairs that will be included in the info response. For example, `management.info.app.name=MyApp` sets the application name in the info response.
8. `management.metrics.export.<exporter-name>.enabled`: This property enables or disables specific metric exporters. For example, `management.metrics.export.prometheus.enabled=true` enables the Prometheus metric exporter.
9. `management.server.port`: This property sets the port on which the management server (actuator endpoints) should listen. By default, it uses the same port as the application server. You can set it to a different port to separate the management endpoints from the main application.
10. `management.endpoints.jmx.exposure.include`: Similar to the web exposure property, this property specifies which actuator endpoints should be exposed over JMX. By default, all endpoints are exposed over JMX.
Frequently Asked Questions
What is the Spring Boot starter used for?
Spring Boot Starters simplify dependency management by bundling commonly used dependencies together for specific development tasks.
What is the use of the Spring Boot Starter Test?
The Spring Boot Starter Test provides essential testing dependencies like JUnit, Mockito, and Spring Test to facilitate unit and integration testing.
How does Spring Boot Starter Security work?
Spring Boot Starter Security auto-configures security settings, providing default authentication and authorization setups for web applications.
Can we use the Spring Boot Actuator in production?
Yes, Spring Boot Actuator can be used in production to monitor and manage applications through health checks and metrics.
What is the default port of the Actuator in Spring Boot?
The default port for the Actuator in Spring Boot is the same as the application's, typically 8080, unless configured otherwise.
Conclusion
In this blog, we have learned about the Spring Boot Starter Actuator, the features of the spring boot actuator, and the different endpoints it provides.
Recommended Readings:
You can also consider our Spring Boot Course to give your career an edge over others.


 18+ registered

