Table of contents
1.
Introduction
2.
About Statistics Page
2.1.
Requirements
2.2.
Add Statistics
2.3.
Change the Viewed Test Run
2.4.
Add Metadata
2.5.
Remove Statistics
2.6.
Compare Test Runs
2.7.
Export Data
2.8.
Stored Results Location
3.
Adding and Configuring Statistics Groups
3.1.
Adding Statistics Groups
3.2.
Changing Displayed Statistics
3.3.
Scaling Statistics in Graphs
4.
Statistics Reference
4.1.
Load Test And Scenario Statistics
4.2.
Test Case Statistics
4.3.
Test Step Statistics
4.4.
Metrics Reference
5.
Frequently Asked Questions
5.1.
What is an analysis of test results?
5.2.
What are performance testing records valuable?
5.3.
Is ReadyAPI a tool for testing?
6.
Conclusion
Last Updated: Mar 27, 2024

Statistics of test results in Ready API

Author Aditi
0 upvote

Introduction

ReadyAPI is a user-friendly tool for no-code API testing intended to make your testing processes more efficient. Scale and automate your end-to-end testing for many API types. Test your functional tests against compatible load tests. Enable virtualization to give your development teams quick and dependable integrations. Agile and DevOps development teams benefit from ReadyAPI's ability to create, organize, and carry out automated functional, security, and performance tests through a single, centralized interface.

Let's dive into the article to learn more about the test results statistics in Ready API.

ready api

About Statistics Page

Use the Statistics page to find out more about the current test run, look up test run statistics from the past, or compare the outcomes of various test runs. Compared to the data on the Load page, the information on this page is more accurate. To provide correct results, ReadyAPI will update the relevant statistics if the information is received after a delay.

On the Load Test Results tile on the Dashboard, you can also see the most recent outcomes of load test runs. If this tile is not already there, you can add it anytime.

Requirements

You must have a ReadyAPI Performance license to utilize the Statistics page. You can ask for it on our website if you don't already have it.
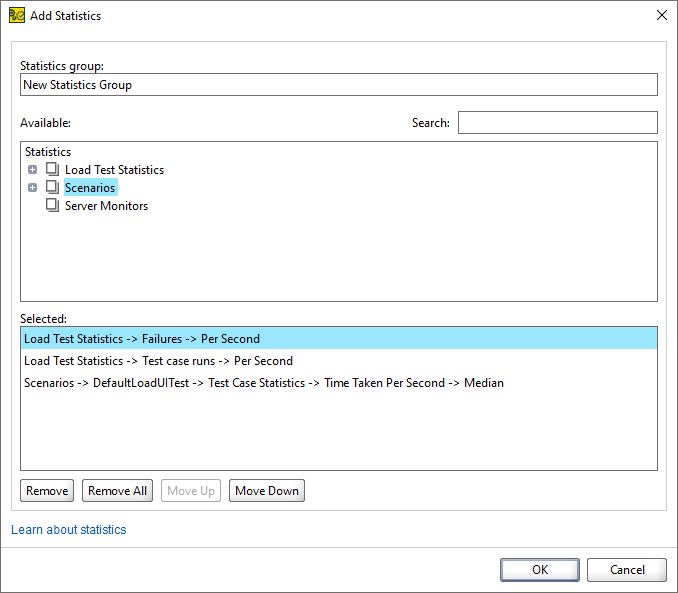
Add Statistics

To add statistics as a table or a graph, click the or button respectively. Dialog for adding statistics will appear.

Change the Viewed Test Run

Choose the necessary test run from the Run drop-down list to alter the test run for which the statistics are shown. The outcomes of the chosen test run will now be shown in the statistics categories you have already added.

The Maximum number of test executions to be saved option determines how many test runs are recorded and shown in the Run drop-down list. Statistics for test steps excluded from the load test are not accessible. The data from these actions will still be included in the load test statistics.

Add Metadata

You can add a comment to the results to make it easier to choose specific test run results from the Run drop-down list. Select the text you want to appear on the list by clicking.

Remove Statistics

Choose the statistic you wish to get rid of and click .

This does not destroy any saved data; it merely removes statistics from the page. The statistics that were removed can easily be added back.

Compare Test Runs

The outcomes of one test run can be compared to those of previously saved test runs. Select the test runs you want to compare by clicking on the toolbar.

Export Data

There are numerous ways to export the information you have gathered:

  • You can generate a report that includes various test run statistics based on several options.
  • Only the information shown on the Statistics page can be used to build a printable report.
  • The Statistics page allows you to export data in CSV format.

Stored Results Location

The databases that store load test results may be found in the <user folder>/.readyapi/loadui/results folder. A separate folder and database are created for each project you run using ReadyAPI. The Performance Testing setting allows you to modify how many results are kept in each database.

Adding and Configuring Statistics Groups

Adding Statistics Groups

A statistics group should be added:

  • Go to the Statistics page in the Performance Tests load test editor. 
  • To add statistics as a graph or table, select one of the buttons or on the toolbar. You'll see the Add Statistic dialogue box
  • Select the statistics you want to display in this dialogue box, then click OK. The same graph can have various statistics added to it. Source
adding statistics group 3
  • Use the Move Up and Move Down buttons to sort the chosen statistics. The following outcomes result from this action:
    • Statistics higher on the list will be displayed over those lower when your statistics overlap in graphs.
    • Table columns are arranged following the ranking of the statistics on the list.
  • Select OK. The table or graph will be included on the Statistics page.

Using the Run drop-down menu, you can choose the data for a separate test run. The outcomes of the selected test run will now be shown in the statistics categories you've added.

Changing Displayed Statistics

Editing a statistics group is comparable to introducing a new one:

  • Click on the toolbar after selecting the statistics group you want to update.
  • Choose the necessary statistics from the Configure Statistics List dialogue. For instance, select Remove to remove any unnecessary statistics.

Scaling Statistics in Graphs

Every statistic added by default to the graph has its scale. This facilitates the reading and analysis of metrics with high and low values. Each metric can be hidden to remove visual clutter.

Similar measurements on a graph will still have distinct scales, even if they are identical. This makes it challenging to analyze the graph. By selecting the Scale the Y-axis equally option, metrics may be compared, and their values can be viewed on the same scale. For you to see which value is higher, the graph will shift to the highest visible value.

The measuring scale with the highest value is applied when the Scale the Y-axis Equally option is enabled. Avoid comparing several measures using the same scale. It could be challenging to compare highly high and low figures.

Statistics Reference

This section of the article will explain to you various load test and scenario statistics, test case, test step statistics.

Load Test And Scenario Statistics

ReadyAPI gathers the following data for load tests and load test scenarios:

Load Test And Scenario Statistics

Test Case Statistics

For test cases, ReadyAPI gathers the following statistics:

Test Case Statistics

Test Step Statistics

For test steps, ReadyAPI Performance compiles the following statistics:

Test Step Statistics

Metrics Reference

The metrics gathered by ReadyAPI during load test runs are shown in the table below:

Metrics Reference

The weighted average is used to get the median, percentile, and standard deviation values.

Frequently Asked Questions

What is an analysis of test results?

Analysis of performance test results. In contrast to scripting and execution, performance test result analysis is the most crucial and technically complex aspect of performance testing. To complete the test result analysis phase and wrap up the testing, a performance tester needs to use his basic skills.

What are performance testing records valuable?

A performance testing results report is essential for identifying the software's flaws and potential improvement areas. Performance testers must employ a successful strategy to fulfill their obligation to provide accurate information about the programs and systems they evaluate.

Is ReadyAPI a tool for testing?

A tool for REST and SOAP API automation testing is called ReadyAPI. ReadyAPI focuses on boosting efficiency and usability when used to test web services. You can simplify thorough web services testing with ReadyAPI.

Conclusion

In this article, we have extensively discussed the statistics of test results in Ready API. We have also explained the ready API, the statistics page, how to add and configure statistics groups, statistics references, and more in detail.

We hope this blog has helped you enhance your Ready API knowledge. If you want to learn more, check out our articles on  introduction to api and its usageWeb API introduction, and real world API. Practice makes a man perfect. To practice and improve yourself in the interview, you can check out Top 100 SQL problemsInterview experienceCoding interview questions, and the Ultimate guide path for interviews.

Do upvote our blog to help other ninjas grow. Happy Coding!

thank you image
Live masterclass