Why do we use data wrangling?
This procedure is crucial for organizations since it is the only way to make raw data useable. Effective data manipulation will assist organizational executives in gaining a birds-eye picture of their whole firm. It also reduces data duplication, which would have influenced decision-making.
Furthermore, because it centralizes various data sources, different divisions within a company may interact and develop creative ideas. To make a sustainable model, it is reasonably necessary to have the optimized dataset to analyze and create high-accuracy models. Let’s learn the essential steps of data wrangling.
Steps of Data Wrangling
There are several essential steps involved that helps data wrangling work the best. We have categorized them under the given labels.
Understand the Dataset
Raw data comprises various formats and layouts, making it necessary to understand our dataset and classify it according to it. It is the first step towards building an efficient and accurate model.
Understanding the data set helps us have prior insights into how we should proceed with the data and wrangle it accordingly.
Re-structuring
Datasets from various sources and systems will arrive in multiple formats, sizes, and kinds. As a result, the data must be reorganized to a standard format at this point. The data should also be classified and divided based on its intended use.
This includes setting the headers finding the number of rows and columns and describing the data type under observation.
Data Cleaning
As the name describes, data cleaning is used for dealing with errors, null values, duplications, and outliers. The data is bought into a similar type that makes the data more optimized.
Most of our data frame modification tools are intended to function with clean data. As a result, cleaning is most simply accomplished once the data set structure has been neatly organized. As a result, I propose executing the reshaping tidying phase first, followed by the cleaning.
Data Augmentation
Augmenting data takes current data and supplement it with additional info to get new insights. For example, if a shop wants to understand how effective their social media advertising is, they might increase their sales data with marketing data.
Validating Data
Validating data signifies the authentication of the data under observation. We authenticate the reliability factor, credibility, and readiness of the data to be processed. This process helps us determine that the data is accurate and not altered by raw data or null values.
Exporting the Dataset
Now that we have covered most of the crucial steps, the last is to publish, share or export the dataset to train our model. The dataset is stored on a sharing platform where all the uses in an organization can make use of it.
Now that we are well versed with the steps involved in data wrangling, let’s look into the implementation of each step.
Implementation of data wrangling
Let’s implement the data wrangling steps on raw data taken from Kaggle about old cars’ price data.
Understanding the Data
Step 1: Import the required libraries such as numPy, Pandas, and matplotlib.
import numpy as np
import pandas as pd
import matplotlib.pyplot as plt

You can also try this code with Online Python Compiler
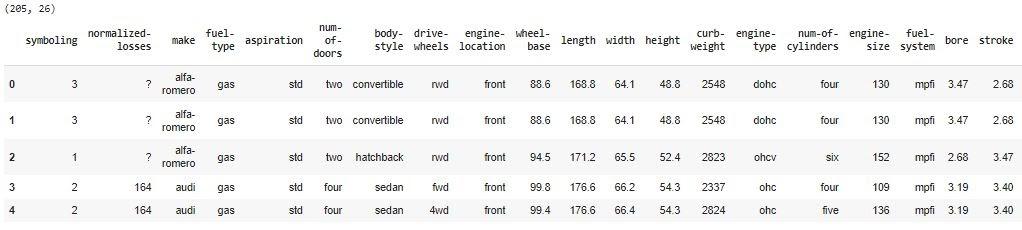
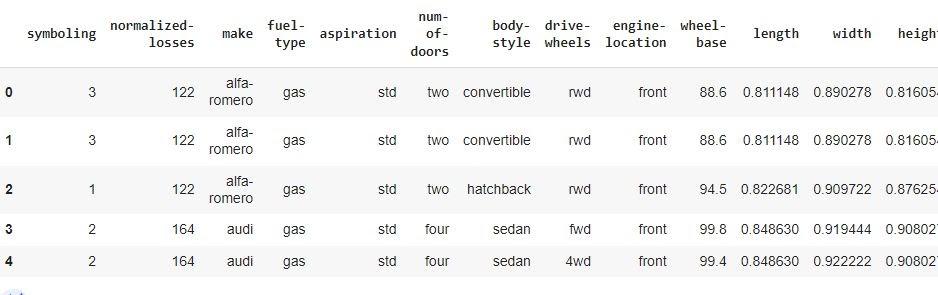
Step 2: Specify the headers and print the table.
cols = ['symboling', 'normalized-losses', 'make', 'fuel-type', 'aspiration', 'num-of-doors', 'body-style', 'drive-wheels', 'engine-location', 'wheel-base', 'length', 'width', 'height', 'curb-weight', 'engine-type', 'num-of-cylinders', 'engine-size', 'fuel-system', 'bore', 'stroke', 'compression-ratio', 'horsepower', 'peak-rpm', 'city-mpg', 'highway-mpg', 'price']
data = pd.read_csv('imports-85.data.txt', names=cols)
print(data.shape)
data.head()
You can also try this code with Online Python Compiler
Output:
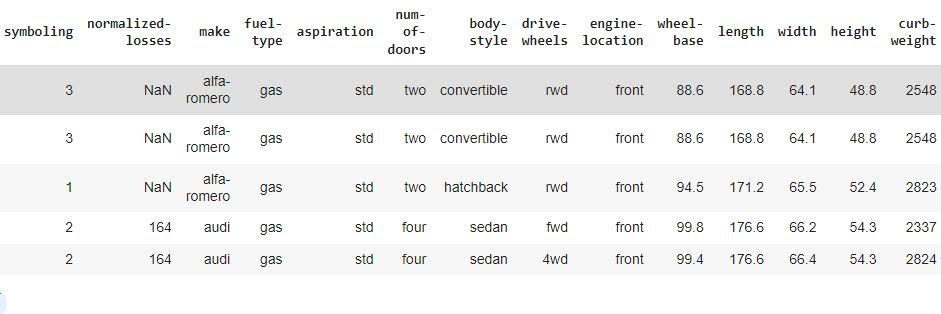
Step 3: Identify and handle missing values
data = data.replace("?", np.NaN)
data.head()
You can also try this code with Online Python Compiler
Output:
Step 4: Search for null data in the given dataset.
data.isnull().any().any()
data.isnull().sum()
You can also try this code with Online Python Compiler
Output:
symboling             0
normalized-losses    41
make                  0
fuel-type             0
aspiration            0
num-of-doors          2
body-style            0
drive-wheels          0
engine-location       0
wheel-base            0
length                0
width                 0
height                0
curb-weight           0
engine-type           0
num-of-cylinders      0
engine-size           0
fuel-system           0
bore                  4
stroke                4
compression-ratio     0
horsepower            2
peak-rpm              2
city-mpg              0
highway-mpg           0
price                 4
dtype: int64
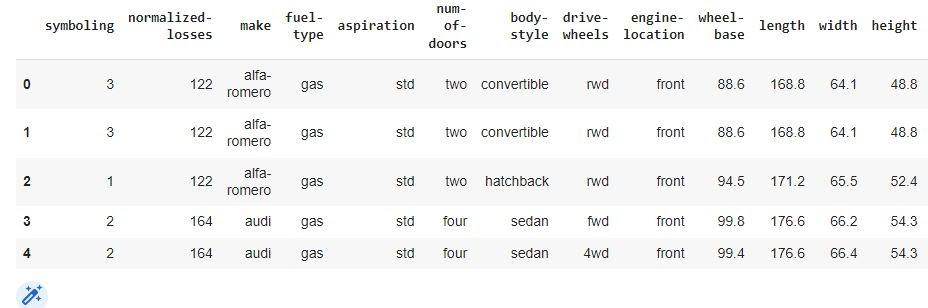
Step 5: Since we know we can replace the null value in a given row or column by taking out the mean and assigning it to the majority of the values, we apply the same here, starting with the row containing the most number of null values.
avg_norm_loss = data['normalized-losses'].astype("float").mean()
avg_norm_loss
You can also try this code with Online Python Compiler
Output:
122.0
data["normalized-losses"].replace(np.NaN, avg_norm_loss, inplace = True)
data["normalized-losses"]
You can also try this code with Online Python Compiler
Output:
0      122
1      122
2      122
3      164
4      164
      ...
200     95
201     95
202     95
203     95
204     95
Name: normalized-losses, Length: 205, dtype: object
avg_bore = data["bore"].astype("float").mean()
data["bore"].replace(np.NaN, avg_bore, inplace = True)
data['bore']
You can also try this code with Online Python Compiler
Output:
0      3.47
1      3.47
2      2.68
3      3.19
4      3.19
       ...
200    3.78
201    3.78
202    3.58
203    3.01
204    3.78
Name: bore, Length: 205, dtype: object
avg_stroke = data["stroke"].astype("float").mean(axis = 0)
print("Average of stroke:", avg_stroke)
data["stroke"].replace(np.nan, avg_stroke, inplace = True)
You can also try this code with Online Python Compiler
avg_horsepower = data['horsepower'].astype('float').mean(axis=0)
print("Average horsepower:", avg_horsepower)
data['horsepower'].replace(np.nan, avg_horsepower, inplace=True)
You can also try this code with Online Python Compiler
avg_peakrpm= data['peak-rpm'].astype('float').mean(axis=0)
print("Average peak rpm:", avg_peakrpm)
data['peak-rpm'].replace(np.nan, avg_peakrpm, inplace=True)
You can also try this code with Online Python Compiler
data['num-of-doors'].value_counts()
You can also try this code with Online Python Compiler
Output:
four    114
two      89
Name: num-of-doors, dtype: int64
data['num-of-doors'].value_counts().idxmax()
You can also try this code with Online Python Compiler
data["num-of-doors"].replace(np.nan, "four", inplace=True)
data.head()
You can also try this code with Online Python Compiler
Output:
Step 6: Drop the rows with NAN values and find the shape.formulatingunderstanding
before_rows = data.shape[0]
data.dropna(subset=["price"], axis=0, inplace=True)
after_rows = data.shape[0]
print("Number of dropped rows {}".format(before_rows - after_rows))
# reset index, because we droped two rows
data.reset_index(drop=True, inplace=True)
You can also try this code with Online Python Compiler
Output:
Number of dropped rows 4
data.shape
You can also try this code with Online Python Compiler
Output:
(201, 26)
data.dtypes
You can also try this code with Online Python Compiler
Output:
symboling              int64
normalized-losses     object
make                  object
fuel-type             object
aspiration            object
num-of-doors          object
body-style            object
drive-wheels          object
engine-location       object
wheel-base           float64
length               float64
width                float64
height               float64
curb-weight            int64
engine-type           object
num-of-cylinders      object
engine-size            int64
fuel-system           object
bore                  object
stroke                object
compression-ratio    float64
horsepower            object
peak-rpm              object
city-mpg               int64
highway-mpg            int64
price                 object
dtype: object
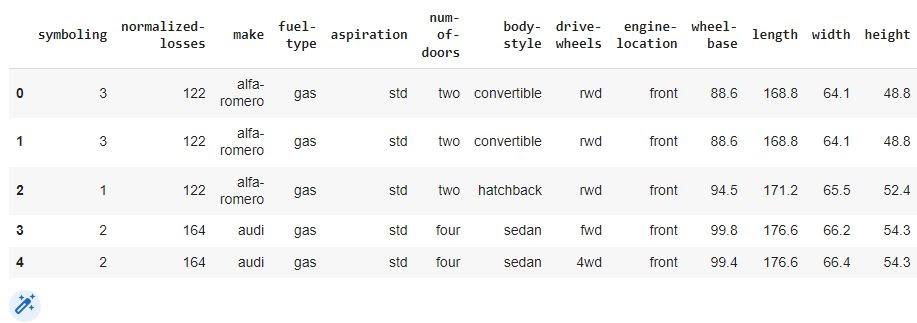
Step 7: Convert the given data into proper format.
data[["bore", "stroke"]] = data[["bore", "stroke"]].astype("float")
data[["normalized-losses"]] = data[["normalized-losses"]].astype("int")
data[["price"]] = data[["price"]].astype("float")
data[["peak-rpm"]] = data[["peak-rpm"]].astype("float")
data.head()
You can also try this code with Online Python Compiler
Output:
Step 8: Standardize the data
# transform mpg to L/100km by mathematical operation (235 divided by mpg)
data["highway-mpg"] = 235/data["highway-mpg"]

# rename column name from "highway-mpg" to "highway-L/100km"
data.rename(columns = {'highway-mpg':'highway-L/100km'}, inplace=True)
You can also try this code with Online Python Compiler
# replace (original value) by (original value)/(maximum value)
data['length'] = data['length']/data['length'].max()
data['width'] = data['width']/data['width'].max()
You can also try this code with Online Python Compiler
data["height"] = data["height"]/data["height"].max()
data["horsepower"] = data["horsepower"].astype(int, copy = True)
You can also try this code with Online Python Compiler
data.head()
You can also try this code with Online Python Compiler
Output:
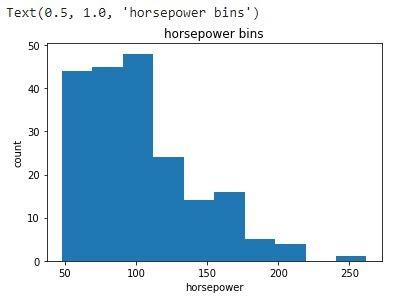
Step 9: Let’s visualize the horsepower column as an example data.
%matplotlib inline
import matplotlib.pyplot as plt
plt.hist(data["horsepower"])

# set x/y labels and plot title
plt.xlabel("horsepower")
plt.ylabel("count")
plt.title("horsepower bins")
You can also try this code with Online Python Compiler
Output:
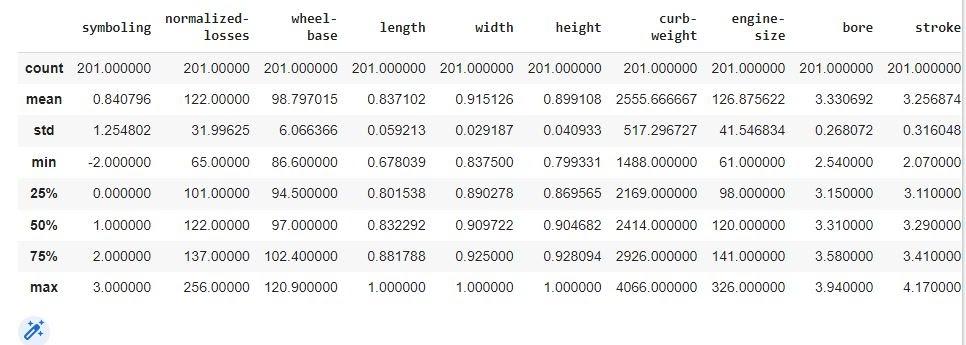
Step 10: Now, describe and export the data.
data.describe()
You can also try this code with Online Python Compiler
Output:
data.to_csv('wrangled_data.csv')
You can also try this code with Online Python Compiler
FAQs
-
Is it necessary to always proceed with data wrangling first?
Raw data (real-world data) is always imperfect and thus cannot be processed by a model. Inevitable mistakes would occur as a result of this. That is why data must be preprocessed before being sent via a model.
-
How does data-wrangling improve data usability?
Data Wrangling enhances data usability by transforming data into a suitable format for the end system. It facilitates the rapid and easy construction of data flows through an Intuitive User Interface, where the data flow process may be simply planned and automated.
-
How should we handle noise in our raw data?
The most straightforward strategy to deal with noisy data is to acquire additional data. The more data you gather, the better you will determine the underlying phenomena that are causing the data to be collected. This will eventually aid in the reduction of noise's impact.
Key Takeaways
The technique of cleaning, reorganizing, and enhancing raw, complicated data into a readable format is known as data wrangling. Effective data-wrangling enables firms to access correct data, allowing them to understand their operations better and formulate informed plans. Discovering, organizing, cleaning, enriching, verifying, and distributing data are the six main tasks in data wrangling. Many business operations, such as fraud detection and consumer behavior analysis, might benefit from data wrangling.
To read more such interesting real-world implementation of concepts, read our blogs at the coding ninjas’ website.


 9+ registered

