Code360 powered by Coding Ninjas X Naukri.com. Code360 powered by Coding Ninjas X Naukri.com
Table of contents
1.
Introduction
2.
An Overview of Big Data
2.1.
Types of Big Data
2.2.
Characteristics of Big Data (5 V’s)
3.
Tableau as a Big Data Solution
3.1.
The Basic Approach to Big Data Analytics
3.2.
Uses of Tableau Software
4.
Frequently Asked Questions
4.1.
What is the purpose of Tableau?
4.2.
What makes Tableau superior to other tools?
4.3.
In Tableau, what can the Worksheet Tool do?
4.4.
What is Tableau Server Repository?
5.
Conclusion
Last Updated: Mar 27, 2024

Tableau and Big Data

Introduction

The current living society has become utterly dependent on data, and a massive amount of data is generated every day. This data is often referred to as "Big Data," which may be in a structured or unstructured format. Different organisations use this data to extract meaningful insights from it.

This article will discuss the basics of big data and how Tableau Software Company is the major solution provider for big data.

After you reach the end of this article, you will clearly understand big data and the Tableau Software company.

An Overview of Big Data

We may define Big Data as a massive collection of data that continues to grow dramatically over time. It is a dataset that is so huge and complicated that no standard data management technologies can effectively store or process it. "Big data" is similar to regular data, but it is much larger.

Companies can use Big Data Analytics to address issues they encounter in their business and efficiently fix these problems. Companies aim to find patterns in this vast amount of data and extract insights from them so that we may use them to solve complex problems for business purposes.
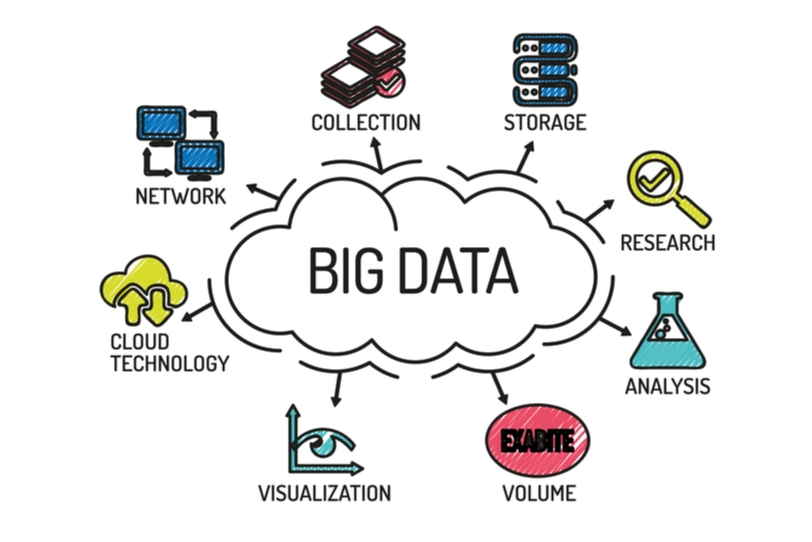
(Big Data, Source: Bleuwire)

Large corporations such as Google and Facebook drive the demand for big data to analyse large amounts of unstructured data. Such data is complicated to handle since it contains billions of records of millions of people's information, such as web social media, photographs, audio, etc. 

Types of Big Data

The following are the types of data:
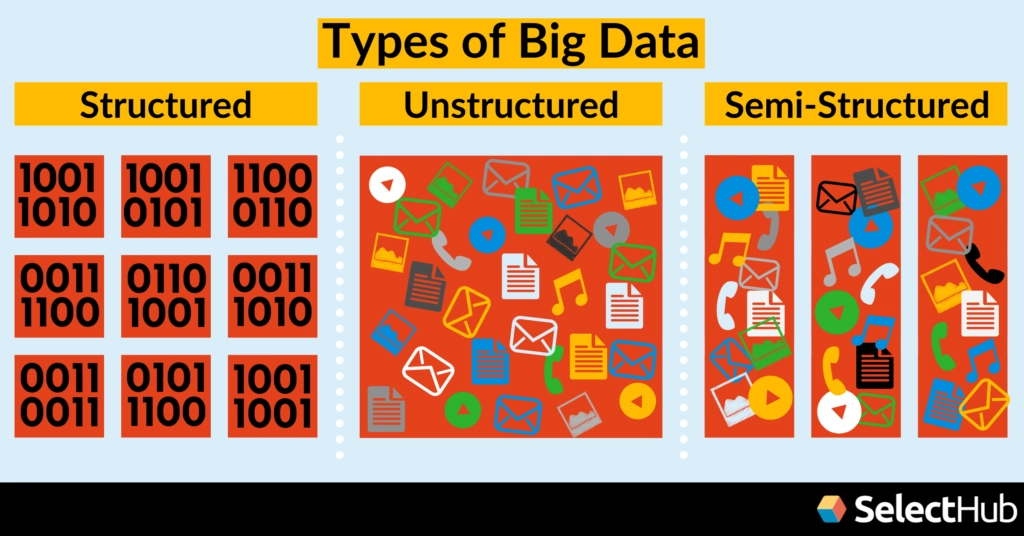
( Types of Big Data, Source: SelectHub )

  1. Structured Data (Organised data)
    If data is well structured, that is, data that can be easily retrieved, stored, and processed, we say it is structured. The columns in this data are well-defined. The data is stored in a specific sequence or with a certain consistency.
    → Structured data is simple to evaluate and process. 
    → It's usually kept in a relational database and queried with Structured Query Language (SQL).
  2. Semi-Structured Data
    Data that is semi-structured can be seen in various formats but not in tables. Semi-structured data is in the middle of the structured and unstructured data spectrum. We can apply a few structured data properties to semi-structured data, but not all. The comma-separated file, XML, is an example of semi-structured data.
  3. Unstructured Data
    Unstructured data is qualitative data with no predefined structure and can be presented in various formats (images, mp3 files, wav files, etc.). Data that is unstructured is said to be lacking in "structure." It's kept in a non-relational database and can be accessed with NoSQL queries.

Characteristics of Big Data (5 V’s)

We can use the following features to describe big data:

  • Volume
    The amount of data being collected is referred to as volume. The data may be structured or unstructured.
  • Velocity
    We call the rate at which data is received as "velocity."
  • Variety
    Variety refers to the various types of data (data types, formats, and so on) that are being submitted for analysis.
  • Value
    The usefulness of the gathered data is referred to as "value."
  • Veracity
    The veracity of data coming in from various sources relates to the quality of the data.

Tableau as a Big Data Solution

In the previous section, we discussed big data in brief. This section will discuss how Tableau Software Company can provide different solutions to handle big data.

Why and how do we need to process this large amount of data? 

With the rise of digitisation, the amount of data produced every day is steadily expanding. Data is becoming increasingly important to businesses. So, businesses are analysing and exploiting big data using powerful software and tools to gain valuable insights that will help them grow their businesses. Let’s look at one such software named Tableau Software.

Tableau is a Business Intelligence software for data analysis and visualisation created in 2003 by Pat Hanrahan, Christian Chabot, and Chris Stolte. Tableau allows you to create interactive dashboards out of graphs, charts, and reports, making it easier for anybody to analyse data patterns and trends across time.

( Tableau Software, Source: Tableau Website )

Tableau may also use drivers and connectors to external data sources and third-party apps to provide valuable insights into various datasets. Tableau Desktop, Tableau Online, Tableau Server, and Tableau Reader are among the four products in the Tableau product suite. Each product suite allows customers to mix many data sources to create data representations that can be shared internally or made publicly available.

The Basic Approach to Big Data Analytics

Big data analytics using Tableau software follows the primary approach of gathering, processing, cleaning, and analysing enormous datasets to assist businesses in operationalising their data.

(Processes of Big Data Analytics)

  1. Data Collection
    Every organisation's data collection method and purpose are different. We keep some data in data warehouses, which will be accessible to business intelligence tools and solutions.
  2. Data Processing
    Once data has been collected and preserved, it must be correctly organised to yield accurate answers to analytical queries, mainly when the data is vast and unstructured.
    Batch processing is one approach for processing substantial data chunks over time. When there is a longer interval between gathering and analysing data, batch processing comes in handy. Stream processing examines small batches of data at a time, cutting the time between data collection and analysis in half.
  3. Data Cleaning
    Data cleaning is correcting or deleting incorrect, corrupted, improperly formatted, duplicate, or incomplete data from a dataset. There are numerous ways for data to be duplicated or mislabeled when merging multiple data sources.
  4. Analysing the Data
    Once data is usable, we can use advanced data analytics processes to gain meaningful insights from it. We use different big data analysis methods such as Data Mining, Predictive Analytics and Deep Learning to analyse Big Data.

Uses of Tableau Software

Tableau software is used in a variety of ways. Tableau makes it easy to perform the following.

  1. Consolidate data from multiple sources into a single format
    Tableau can bring data from Excel and Access, SQL databases, and cloud-based applications such as Salesforce together in seconds. There is no need for a code. This is one of the Tableau features that allows you to see the whole picture of your firm and have a single source for all business reports.
  2. Immediately complete basic ETL operations.
    One of Tableau's best features is doing basic ETL operations quickly. With Tableau's automated data reshaper tool, you can swiftly turn data into your required format. You can split fields, concatenate fields, connect on concatenated or calculated fields, remove white space and headers, and alter data formats with just a few clicks. What used to take a SQL programmer several minutes to create code for or a businessperson a day to perform in Excel can now be done in seconds.
  3. Quick Data Analysis
    The most crucial use of Tableau software is that it allows analysts to quickly explore their data, assisting them in finding answers that lead to new questions, which lead to new insights as quickly as they can think of them.
  4. Automated Reporting
    Automated reporting is one of the applications of Tableau software. You may easily create a report, point it to a specific data set, have the data automatically refreshed, and never touch it again. Set things up, and all you have to do now is look for insights and act on them. There is no need for a code, additional time, or further meetings.


Read about Batch Operating System here.

Frequently Asked Questions

What is the purpose of Tableau?

Tableau is a data visualisation and business intelligence application that can report and analyse large amounts of data.
 

What makes Tableau superior to other tools?

Compared to other Big Data solutions, Tableau allows you to produce sophisticated graphics in seconds! It allows you to complete complex jobs using simple drag-and-drop functionality, allowing you to answer your inquiries quickly!
 

In Tableau, what can the Worksheet Tool do?

In the Tableau screen, the worksheet is where you develop data analysis views. When you first connect to a data source, Tableau creates three blank worksheets by default.
 

What is Tableau Server Repository?

The Tableau Server repository is a PostgreSQL database that keeps track of all user interactions. Tableau Server users, groups, group assignments, permissions, projects, data sources, extract metadata, and refresh information are all included.

Conclusion

This article extensively discussed Big Data and Tableau Software as a solution to Big Data. We started by giving an overview of Big Data, then looked at different types of Big Data, characteristics of Big Data, an overview of Tableau software, and its uses in Big Data Analytics.

We hope that this blog has helped you enhance your knowledge regarding Big Data Analytics and Tableau Software and if you would like to learn more, check out our articles on ‘Text Analytics with Big Data’, ‘Big Data Analytics’, ‘Ten Big Data Practices’, ‘Handling of Big Data’. Do upvote our blog to help other ninjas grow.

Head over to practice problems on our platform, Coding Ninjas Studio to practice top problems, attempt Top 100 SQL Problems, read interview experiences, and much more.!

Happy Reading!

Live masterclass