Do you think IIT Guwahati certified course can help you in your career?
Introduction
Data wrangling is one of the most essential preparatory steps while dealing with raw data obtained from various unordered sources. For processing raw data and further steps in machine learning, our first step is data analysis or data wrangling. We have already discussed in-depth data wrangling in our previous blog.
In this blog, we will be talking about the tools for data wrangling that one can use, which would help keep ML enthusiasts the first step in the right direction while dealing with the data.
Why Do We Require Tools for Data Wrangling?
Tools in any field help make our lives easier by automating the chores we would have to do manually. Similarly, in this case, tools help us observe various dimensions and hideouts of data points in the given raw data sets, making our job easier in wrangling the datasets.
Employing data integration tools with automated features that filter and transform datasets into a reusable format as per the eventual needs, data wrangling may be organized into a consistent and repeatable routine. You may do critical cross-data set analyses after converting raw data to a standard format. Furthermore, Python data wrangling is the most frequent, as Python uses various methods to wrangle data contained across multiple data sets.
There are several tools for data wrangling that data analysts, ML enthusiasts, and professionals use. We are going to talk about the most popular tools that are used to organize data.
Tools For Data Wrangling
Usage of tools for data wrangling depends on person to person depending on their priority and which tool suits them the best. But in this blog, we will discuss some of the most used tools for data wrangling and categorize them accordingly.
Spreadsheets
Spreadsheets are aesthetic tools that allow you to modify how text and numbers are displayed, a process known as formatting. It can be beneficial and aid in presenting facts in methods that make it easier to use and comprehend. It can also make the data more difficult to see, which is harmful if not used appropriately.
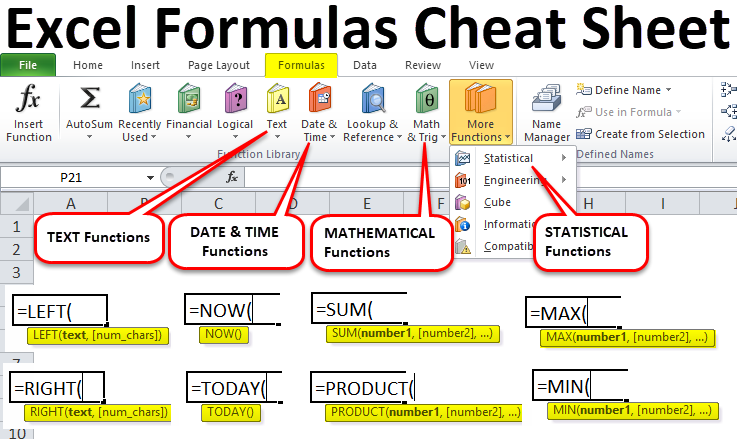
Excel
Microsoft Excel is a well-known tool all around the globe, not just for data wrangling but several other applications. It offers several mathematical functions that can be performed on the given data according to the need and cleansing that the data requires. Below is an example of the functions offered by Microsoft Excel that help in Data Wrangling.
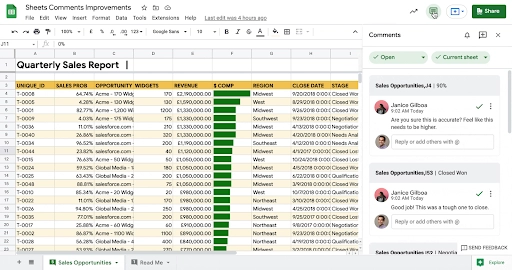
Google Sheets has more than 400 features. Most of these tools are also available using Google Sheets frequently work with data in right-to-left languages, which Google Sheets handles slightly better than Excel.
The above image is a demonstration of the UI of google sheets. These Google Sheets methods are divided into several types depending on the data given, although any of the hundreds could be helpful in your data manipulation.
Self-Service Data Visualization
Tableau
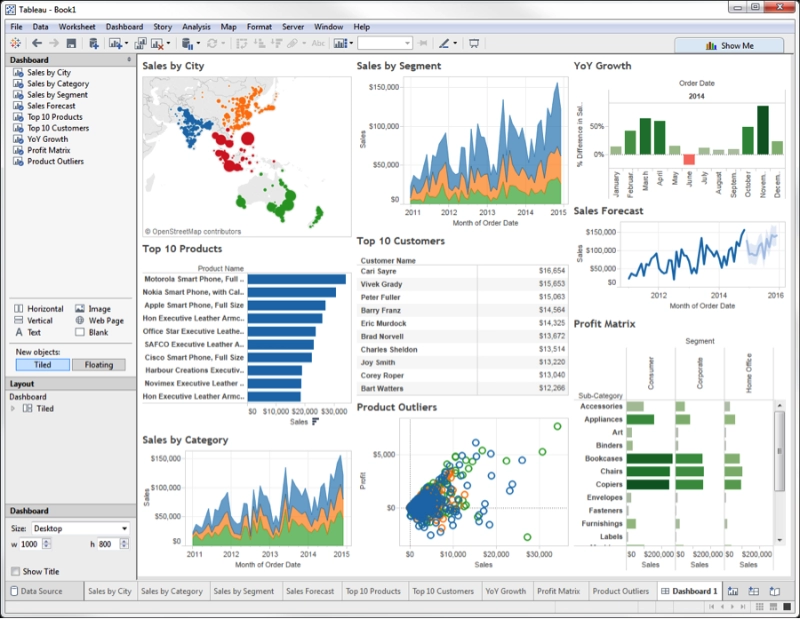
Tableau is a well-known data preparation program that assists you in shaping, combining, and refining your data in preparation for final analysis. It simplifies and intuitively organizes your info.
Tableau Prep is a user-friendly data preparation tool that quickly combines, shapes, and refines data to perform analysis. While operating, you can construct your database extract and release its sources on the Tableau Server, Tableau Online, and perhaps even the Tableau Desktop application. You can always see your data, repair value errors directly, and see the results of any modification you make.
Tableau comes with three built-in integrated views that enable you to see row-level data, column profiles, and your whole data preprocessing process. You may quickly select the view you wish to see based on the task you're working on. It allows you to automate tedious processes with a single click. The clever function will enable you to resolve typical data preparation concerns swiftly. You can use Tableau Desktop to access your data output.
Power BI
Microsoft Power BI is a corporate analytics application that allows you to analyze, visualize, and share data. It uses sophisticated real-time user interfaces for every device to offer efficient business monitoring for swift and accurate managerial decision-making.
Microsoft Power BI allows users to turn data into visualizations accessed with associates across several devices. It provides visual data extraction and analysis both on-premises and in the cloud. Users may engage in analyses and create customized dashboards with interactive data reporting. It has built-in security and control capabilities that are extensible across your organization.
It has dynamic and real-time interfaces with statistics built-in, allowing for data visualization. It aids in the generation of meaningful business intelligence. It has a functionality that will enable users to create unique apps in mins rather than hours and connect them to your data effortlessly. It integrates powerful workflow automation straight into your app without requiring any coding. This gives you access to a plethora of well-known apps and services.
Businesses, non-profit organizations, and health professionals need data professionals, computer scientists, analytics leaders, BI directors, IT and information management teams, and data management teams.
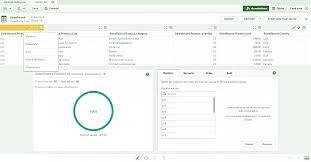
Qlik Sense
Qlik is a business analytics solution that offers a comprehensive set of sophisticated analyses for BI. Qlik Sense is the company's most efficient and sophisticated multi-cloud solution for modern business intelligence.
Qlik is a vital next-generation tool for data wrangling and analysis that swiftly merges various data sources, regardless of their size or number. It has a variety of interactive options as well as a general search option. You can produce visually appealing and accurate data outcomes, including smart visualization and AI-integrated recommendations.
You consolidate all datasets into a single integrated view, irrespective of size or complexity. Qlik's association engine indexes every potential data relationship, allowing rapid insights. Also, it will enable us to assess data in the direction you want.
There is no pre-aggregation of data containing pre-defined queries, so you can ask questions and generate new analytics without the help of a specialist. You may use it on any device and get the most out of it. Qlik Sense Enterprise and Qlik Sense Cloud are two versions of Qlik Sense Enterprise with comprehensive and flexible security.
Programming-Languages
R
R Programming Language is frequently referred to be "a statistical language designed by statisticians." You'll almost certainly find an exotic statistical model for your computations on CRAN — it's not named the Comprehensive R Archive Network for nothing, after all. You can't match ggplot2 for analysis and charting. You can also utilize the SparkR mappings to run Spark on R if you require more power than your system can provide.
However, getting started with R can be challenging if you aren't a data scientist and haven't worked with Matlab, SAS, or OCTAVE previously. While it's fantastic for data wrangling and analysis, it's not so great for other things.
Python
If business data scientists don't know R, they'll undoubtedly learn Python. Python has been widely used in academics for over a decade, particularly in fields such as Machine Learning ML. As a result, if you have a project that requires ML work, you'll be faced with a bewildering array of options, including the basic NTLK, topic modeling using GenSim, or the lightning-quick and accurate spaCy.
Similarly, Python punches well beyond its weight with Theano and Tensorflow for neural networking; there's also scikit-learn for machine learning and NumPy and Pandas for data analysis.
There's also Juypter/iPython, and an Internet notebook server that lets you mix code, graphs, and nearly anything else into a sharing logbook format. This was formerly considered one of Python's most compelling features. Still, the concept has since spread to practically all languages that include a Read-Evaluate-Print-Loop (REPL) paradigm, including Scala and R.
Big Data Tools
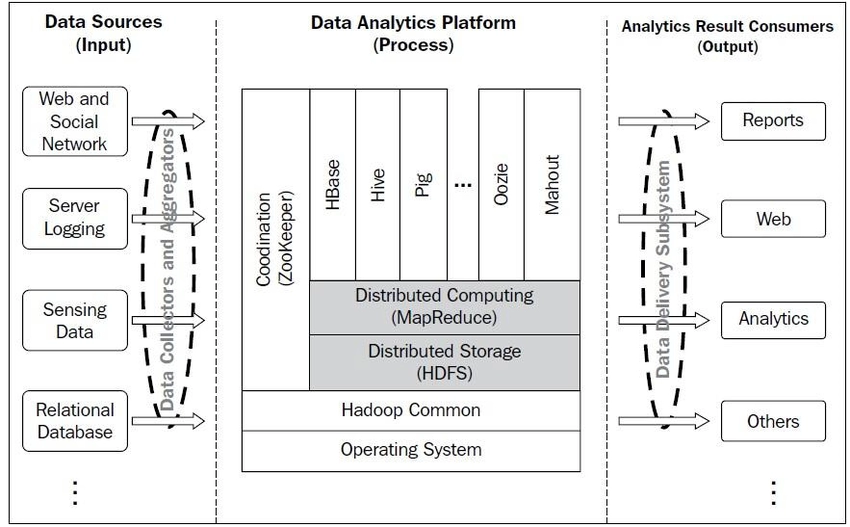
Hadoop
Hadoop has several advantages that make it the platform of choice for data wrangling and analysis. Hadoop is versatile and cost-effective because it can quickly and efficiently store and process large amounts of any type of data (structured or unstructured) utilizing a network of commodity hardware.
Thanks to resource sharing, more computing power is available inside the cluster at a lower cost than on a single server. Furthermore, Hadoop is exceptionally scalable, as additional computing nodes may be quickly added to the cluster if more processing capacity is required.
Hadoop also offers a high level of fault tolerance; if one of the cluster's nodes fails, the processing jobs are reallocated among the remaining nodes, and several copies of the data are stored inside this Hadoop cluster.
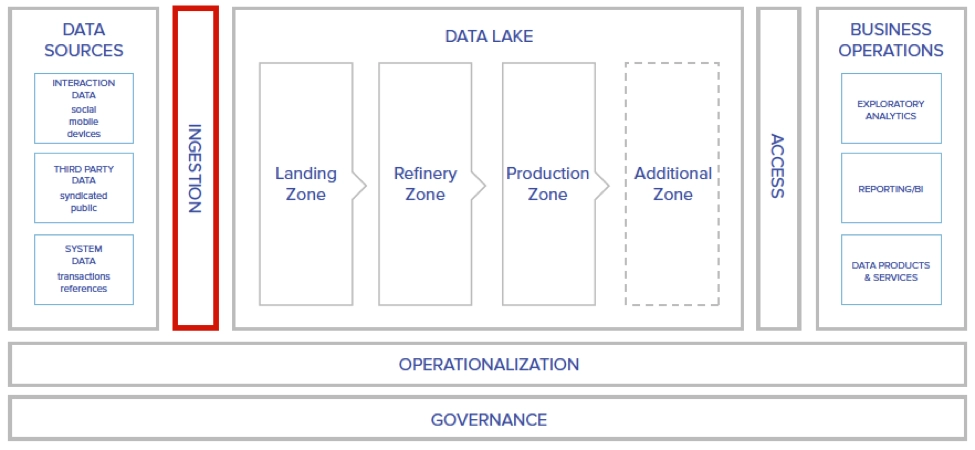
Data Lakes
Data lakes are used to store large amounts of massive data, which can be structured, unstructured, or semistructured. Relational databases, which are the foundation of most data warehouses, aren't well suited to such situations. Relational systems necessitate a strict data schema, limiting users to storing structured transaction data.
Data lakes can accommodate a variety of schemas and don't need any prior definition. As a result, they can handle many kinds of data in various formats.
As a result, data lakes have become a critical component of many firms' data architectures.
Companies primarily utilize these as a framework for data wrangling and other data science applications that require enormous amounts of data and use modern analytics techniques like data mining, predictive modeling, and machine learning.
Cloud
Microsoft Azure
Azure Data Factory is usually the preferred choice on the Microsoft cloud platform for establishing data pipelines and processing data from several data sources, which is graphical in design. Still, it often requires scripting for many basic data wrangling chores.
On the other hand, Power Query is a GUI-based interface that allows you to conduct such monotonous chores in a very efficient manner utilizing an Excel-like interface.
Azure Data Factory recently gained Power Query interoperability, allowing users to create data factory templates and use them in Data Factory pipelines for Data Wrangling.
AWS platform
Amazon Web Services (AWS) is a well-known and commonly utilized data preprocessing platform. It's an IaaS (Infrastructure as a Service) solution that's simple to get started with.
Amazon Web Services provides a multi-functional platform with various Amazon Cloud Services and third-party integration options. There is a variety of APIs available as well. It supports a wide selection of Windows and Linux servers for a lower initial investment. Finance, marketing, business, consultancy, technology, health, and various other industries are all served.
Frequently Asked Questions
Q1. What are the different kinds of databases used for data wrangling?
Ans: For data-wrangling, mainly have relational, column, graph, and document. Under relational databases, we use Microsoft Access, SQL Server, and Oracle. The most used database under such categorizes relational.
Q2. Which platform is the best for our computational use of data wrangling?
Ans: The one that suits the user the best is what people should choose. There are several ways of wrangling the data that involve technical parts while others don't. The best one depends on the utility of the user.
Q3.Which tools are suited the best in Python?
Ans: Numpy and Pandas framework is the best suited for the job. Pandas is particularly an open-source library made for data analysis. At the same time, numpy is best known for its data cleaning abilities.
Key Takeaways
This article, which is a continuation of the previous article, talked about data wrangling steps; we have discussed the tools for data wrangling. We talked about the various tools by categorizing them according to the software or the use they are based on. We have also covered how these tools are sufficient for the job and how they make the best possible result of the model by cleansing the data in the initial steps of data wrangling. To learn more about Data Wrangling, follow our blogs to understand the subject better.
Live masterclass
Prompt Engineering: Must-have GenAI Skill for 30L+ Roles at Amazon
by Anubhav Sinha
16 Jul, 2026
12:30 PM
Using Netflix Data to Master Power BI
by Ashwin Goyal
13 Jul, 2026
12:30 PM
Top GenAI Skills to crack 30L+ CTC at Amazon & Google
by Sumit Shukla
14 Jul, 2026
11:30 AM
JioHotstar Sports Analytics using IPL Dataset
by Prerita Agarwal
15 Jul, 2026
12:30 PM
Prompt Engineering: Must-have GenAI Skill for 30L+ Roles at Amazon


 9+ registered

