Table of contents
1.
Introduction
2.
What is State Chart Diagram?
2.1.
Components Of A State Chart Diagram
3.
How to draw a State Chart Diagram?
4.
Example of State Chart Diagram
5.
Where to Use State Chart Diagrams?
6.
State Diagram vs Flowchart
7.
Frequently Asked Questions
7.1.
What is the difference between structure and behavior UML diagrams?
7.2.
What is the difference between a state diagram's fork and join components?
7.3.
What is the difference between the state and class diagrams?
7.4.
What are the basic elements of state chart diagram?
8.
Conclusion
Last Updated: Jul 12, 2024
Medium

UML State Chart Diagram

Author Pakhi Garg
0 upvote
Career growth poll
Do you think IIT Guwahati certified course can help you in your career?

Introduction

The Unified Modelling Language (UML) is a modelling language that can be used for a variety of purposes. The primary goal of UML is to define a standard way to visualise how a system was designed. Moreover, it is a visual language, not a programming language. They are used to depict the behaviour and structure of a system. UMLs are very similar to blueprints, which are used in other engineering fields.

UML State Chart Diagram

There are two types of UML diagrams-

  1. Structure Diagrams- These diagrams model the structure or static aspect of the system. Examples of structural diagrams are class diagrams, object diagrams, package diagrams and deployment diagrams.
  2. Behaviour Diagrams- These diagrams model the behaviour or dynamic aspect of the system. They simply guide us through the system’s functionality. Examples of behaviour diagrams are state diagrams, class diagrams, activity diagrams and interaction diagrams.

This article will discuss state diagrams in detail.

What is State Chart Diagram?

The state diagram is a behaviour UML diagram. So, it depicts the behaviour or dynamic aspect of a system. By dynamic aspect, we mean that a state diagram represents the state or condition of a system at a finite instance of time. These diagrams are also known as state machine diagrams or state chart diagrams.

Now, let’s dive deep into the state diagram.

Components Of A State Chart Diagram

Following are the components of a state diagram-

  1. Initial State- Initial state represents the starting point of the state diagram. A black filled circle represents it.

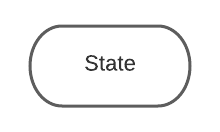
2. State - State represents the condition of a system at a finite instance of time. A rounded rectangle represents it.

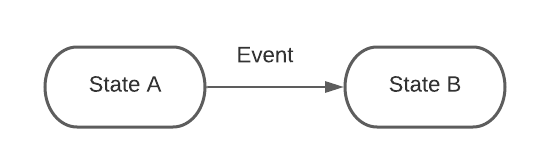
3. Transition - Transition represents a change in control from one state to another caused by the occurrence of an event. A solid arrow represents it.

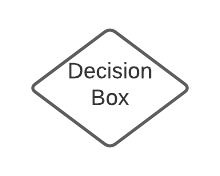
4. Decision box - The decision box represents the decisions that will be made based on an evaluated guard. A diamond shape represents it.

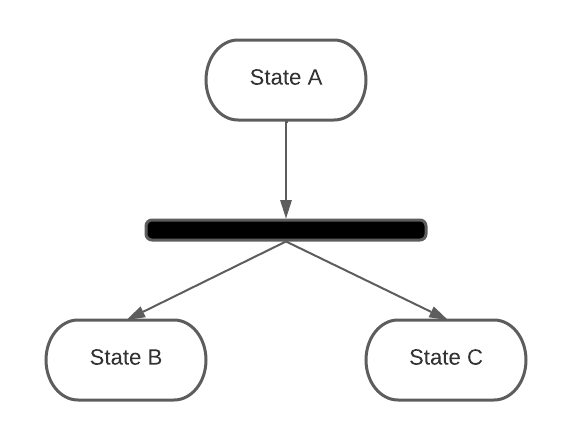
5. Fork - A fork represents a state splitting into two or more concurrent states. It is represented by a rounded rectangular solid bar with arrows incoming from the parent state and towards the concurrent states. 

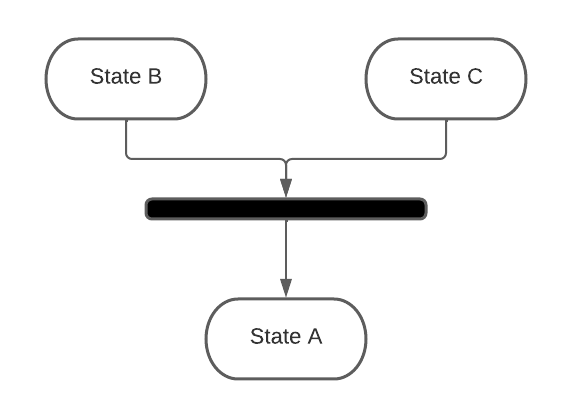
6. Join- A join represents two or more states converging into one state. It is represented by a rounded rectangular solid bar with arrows that are incoming from the concurrent states and towards the common state.

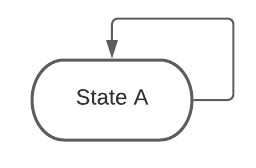
7. Self Transition- Self transition represents the scenarios when the state of an object does not change upon the occurrence of an event. It is represented by a solid arrow pointing to the state itself.

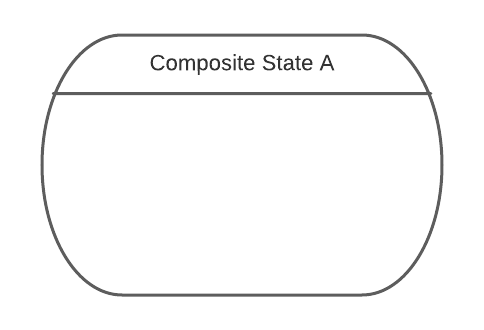
8. Composite State- Composite state represents a state having internal states or nested states. It is also represented by a rounded rectangle like the state component.

9. Final State- Final state represents the ending point of the state diagram. Two concurrent circles represent it, with the inner circle filled with black colour.

After the components, let’s see the steps to draw a state diagram.

How to draw a State Chart Diagram?

Since a state diagram mainly involves states and their occurrence, we must identify all the possible states of a specific component before drawing a state diagram.

Following are the steps to be followed for drawing a state chart diagram.

  1. Identify the initial state and final state.
  2. Identify the possible states.
  3. Give a unique and meaningful name to each state.
  4. If there are multiple objects, implement the essential ones.
  5. Depict the transition between the states and label the events.
  6. Give a proper name to the transitions and events.

Now, we will take an example to draw a state diagram.

Example of State Chart Diagram

In this example, we will draw the state diagram for an online shopping system

Note: Since an online shopping system is vast, we will consider only the basic functionalities to understand the concept. You can add more functionalities according to your needs.

In an online shopping system, 

  1. The user first logs in to his account. 
  2. After logging in, he has two choices: to search for items to purchase and to check his existing products in the cart
  3. If he chooses the first option, i.e. searching for items to purchase, 
    1. He will search for the required item in the search box. He will add the item to his shopping cart if the item is found.
    2. He may search for more items.
    3. If the item is not found, he will again search for the item.
    4. After adding the item to the cart, he will see his updated cart and checkout.
  4. If he chooses the second option, i.e. checking his existing products in the cart,
    1. He will select an item to purchase and will checkout.
  5. After placing an order for the item, the user will log out from the system.

Below is the state diagram for an online shopping system.

In our state diagram, 

  • We have defined five states- Login, Search Items, Add to Cart, Go to Cart and Checkout with transitions from one state to another.
  • There is one decision box for checking whether the item is found or not.
  • For each transition, we have defined events accordingly.

Now, we will discuss the uses of a state diagram.

Where to Use State Chart Diagrams?

Since state diagrams are used to detail real-world working models and object-oriented systems. By capturing the dynamic behaviour of a system, these diagrams are used to compare the dynamic and static nature. Below are some uses of a state UML diagram.

  1. State diagrams are used to simulate a system’s object states.
  2. They are used to model the reactive system, which comprises reactive objects.
  3. They are used for determining the events that cause state transitions.
  4. They are used to carry out forward and reverse engineering.

Since we have a brief description of the state diagram, you must be thinking that a state diagram is very similar to a flowchart. But this is not the case. Both state diagrams and flowcharts are pretty different from each other. Let’s discuss this difference.

Also read about  V Model in Software Engineering

State Diagram vs Flowchart

Below are the key differences between a state diagram and a flowchart.

S.No

State Diagram

Flowchart

1.Its main aim is to depict the different states of a system.Its main aim is to depict the flow of execution of a system.
2.Its primary focus is on the states.Its primary focus is on the path.
3.It is a UML diagram.It is a Data Flow Diagram (DFD).
4.It follows the WAIT concept, i.e. wait for an action or event.It does not follow the concept of WAIT.
5.This diagram is usually made for real-world systems.This diagram can be made for any type of system.

Frequently Asked Questions

What is the difference between structure and behavior UML diagrams?

Structure UML diagrams model the structure or static aspect of the system. Examples of structural diagrams are class, object, package, and deployment diagrams. In comparison, Behavior UML diagrams model the behavior or dynamic aspect of the system. They simply guide us through the system’s functionality. Examples of behavior diagrams are state, class, activity, and interaction diagrams.

What is the difference between a state diagram's fork and join components?

A fork represents a state splitting into two or more concurrent states. It is represented by a rounded rectangular solid bar with arrows that are incoming from the parent state and towards the concurrent states. In contrast, a join represents two or more states converging into one state. It is represented by a rounded rectangular solid bar with arrows that are incoming from the concurrent states and towards the common state.

What is the difference between the state and class diagrams?

State diagram represents the state or condition of a system at a finite instance of time. At the same time, a class diagram is used to visualise, describe, and document various aspects of a system and build executable code for a software application. 

What are the basic elements of state chart diagram?

The basic elements of a state chart diagram include states, transitions, events, actions, initial state, final state, and decision nodes. These elements represent the various conditions, triggers, activities, starting point, end point, and branching decisions, respectively, modeling an object's dynamic behavior in a system.

Conclusion

To summarize, in this article, we studied the state UML diagram. We extensively discussed the topic along with the components, steps, an example and uses of the state diagram.

If you want to study Software Engineering, and What is Application software you can refer to the Library section of Code360

Check out other blogs on object-oriented software design topics, Sequence Diagram and Object Diagram.

Live masterclass