


Introduction
Variance is the measure of the average of squared values of the dataset from each point to the mean. If the variance of any dataset is zero, it means all values are identical. Standard deviation is calculated simply as the square root of the variance. It is one of the popular measures of variability as it can return the original units of the data values. In this article, we will be covering both these terms variance and standard deviation and learn how to implement them using python. So let’s get started and dive more into the terms variance and standard deviation.
Also, see - Locally Weighted Regression.
Variance
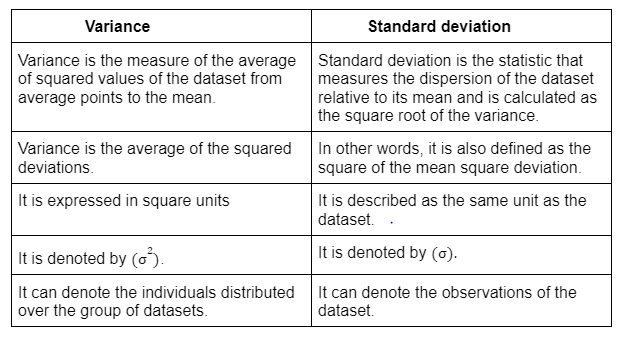
Variance is responsible for quantifying spread or dispersion. The characteristics of sample or production describe how much changeability is in it.
High variance signifies that dataset values are far from their mean. Our dataset will be responsible for high levels of variability. On the other side, low variance signifies that the values are very close to their mean. Our dataset will be responsible for low levels of variability. The steps for calculating variance are:
- First, calculate the mean(the average of the numbers).
- For finding the squared difference, for every number subtract the result and then find its square.
- Lastly, find the average between the squared differences.
The variance is expressed by the following mathematical expression:
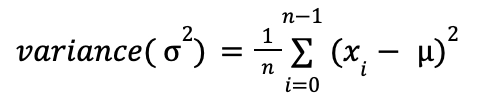
In the expression given above, 2is the representation for variance, xistands for the individual values from the dataset. depicts the mean or average value of the dataset and n is the total number of values in the dataset. Now, let’s go through an example for a better understanding. Let’s say you have 5 boxes and their heights are as follows: 120mm, 200mm, 150mm, 400mm, and 320mm.
Mean = (120+200+150+400+320)/5
= 1190/5
= 934
So, the mean is 934mm. Now, let’s calculate the difference between the heights. The difference are: -814, -734, -784, -534, -614. Now, we have reached to the final step. Let’s calculate the variance.
Variance = (-814)2+(-734)2+(-784)2+(-534)2+(-614)2/ 5
= ( 662596 + 538756 + 614656 + 285156 + 376996) / 5
= 495632
Hence, the variance is found to be 495632.
Standard deviation =495632
= 704.011
Implementation using python
The average can be calculated using the numpy.average() in python. The syntax for the same looks like:
Syntax:
numpy.average(a, axis=None, weights=None, returned=false)
Parameters are:
a: a is the array of data values to be averaged,
axis: the value with which axes to be done with a,
weights: it signifies an array of weights value,
returned: the default value is set to false. If it is true, only a tuple will be returned.
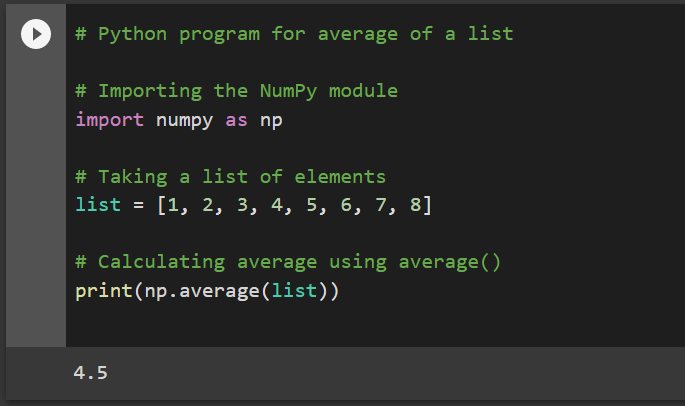
# Python program for average of a list

# Importing the NumPy module
import numpy as np

# Taking a list of elements
list = [1, 2, 3, 4, 5, 6, 7, 8]

# Calculating average using average()
print(np.average(list))
Output:
Now, for calculating the variance, take the same dataset as in average. First, calculate the deviations from their mean then find the average of their squared values.
In general,
(1-4.5)2=12.25
(2-4.5)2=6.25
(3-4.5)2=2.25
(4-4.5)2=0.25
(5-4.5)2=0.25
(6-4.5)2=2.25
(7-4.5)2=6.25
(8-4.5)2=12.25
Variance = (12.25+6.25+2.25+0.25+0.25+2.25+6.25+12.25) / 8 = 5.25
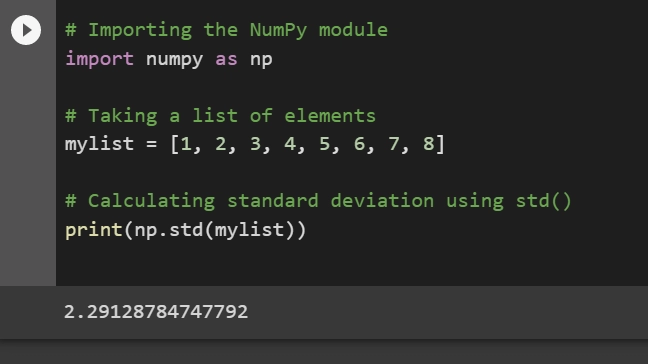
# Python program for average of a list

# Importing the NumPy module
import numpy as np

# Taking a list of elements
list = [1, 2, 3, 4, 5, 6, 7, 8]

# Calculating variance using var()
print(np.var(list))
Output:


 9+ registered

