


Introduction
A model deployed in production performs its optimal on prediction input data that is similar to the training data. When the input data changes or deviates from the data used to train the model, the performance of the model can deteriorate, even if the model itself has not changed.
To help you maintain the performance of the model, Model Monitoring monitors the model's prediction input data for feature drift and skew:
- Training-serving skew happens when the feature data distribution in production changes from the distribution of data that is used to train the model. If the original training data is present, you can enable skew detection to monitor your models for training-serving skew.
- Prediction drift happens when feature data distribution in production changes significantly over time. If the original training data is not available, you can enable drift detection to monitor the input data for changes over time.
You can enable both drift and skew detection.
Model Monitoring supports feature skew and drifts detection for categorical and numerical features:
- Categorical features are data limited by a number of possible values, typically grouped by qualitative properties. For eg, categories such as product country, type, or customer type.
- Numerical features are those that can be any numeric value. For eg, weight and height.
The below example shows skew or drift between the baseline and latest distributions of a categorical feature:

Baseline distribution

Latest Distribution
Monitor feature skew and drift
The below steps describes how to create, manage, and interpret the results of Model Monitoring jobs for models deployed to online prediction endpoints. Vertex AI Model Monitoring supports feature skew and drift detection for categorical and numerical input features.
You can enable skew detection if you provide the original training dataset for your model; otherwise, you should enable drift detection.
Create a Model Monitoring job
To set up either drift or skew detection, create a model deployment monitoring job:
- In the Google Cloud console, move to the Vertex AI Endpoints page.
- Click on the Create Endpoint.
- In the New endpoint pane, set a region and name your endpoint.
- Click on Continue.
- In the Model name field, choose an imported tabular AutoML model or custom training.
- In the Version field, choose a version for your model.
- Click on Continue.
- In the Model monitoring pane, ensure Enable model monitoring for this endpoint is toggled on.
- Enter a Monitoring job display name.
- Click on Continue. The Monitoring objective pane opens up, with options for drift or skew detection:
Skew detection
- Select the Training-serving skew detection.
- Under Training data source, you can provide a training data source.
- Under Target column, you can input the column name from the training data that the model is trained to predict. This field is not included from the monitoring analysis.
- Under Alert thresholds, you can specify thresholds at which to trigger alerts.(Optional)
- Click Create.
Drift Detection
- Select the Prediction drift detection.
- Under Alert thresholds, select thresholds at which to trigger alerts.(Optional)
- Click Create.
Update a Model Monitoring job
You can pause, view, update, and delete a Model Monitoring job. You must pause a job before you can delete it.
Pausing and deleting is not possible in the console; we can instead use the gcloud CLI.
To update the parameters for a Model Monitoring job:
- In the console, move to the Vertex AI Endpoints page.
- Click the name of the endpoint you want to edit.
- Click Edit settings.
- In the Edit endpoint pane, select the Model monitoring or Monitoring objectives. Update the parameters you want to change.
- Click Update.
To view alerts, metrics, and monitoring properties for a model:
- In the console, move to the Vertex AI Endpoints page.
- Click endpoint name.
- In the Monitoring column for the model, you want to view, select Enabled.
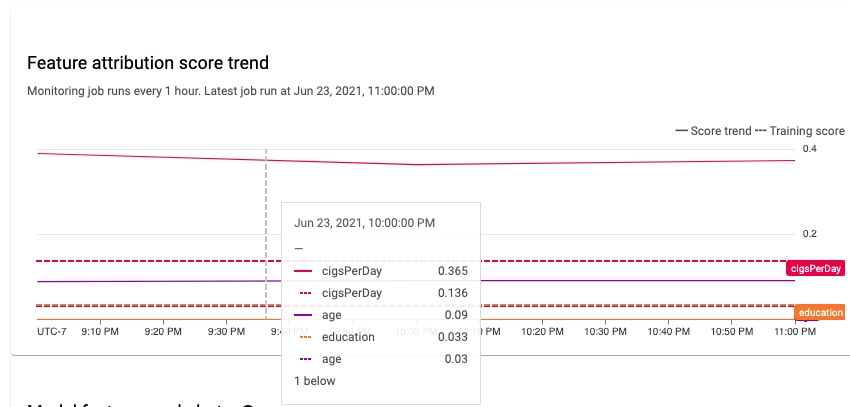
Analyze skew and drift data
By using the console, you can see how each monitored feature's distributions vary over time and discover what changes caused skew or drift. The feature value distributions can be seen as a histogram.
Go to the Endpoints page of the console to access the feature distribution histograms.
- Click the endpoint you want to study on the Endpoints page.
- A list of all the models installed on the endpoint is available on the detail page for the endpoint you chose. To analyse a model, click its name.
- The details page for the model lists the model's input features and pertinent information.
- Click the name of the feature, to analyze a feature.


 9+ registered

