


Introduction
Katalon is an automating testing software that lets the users test web, mobile or desktop applications and APIs without coding to deliver efficient and robust software to the consumers. The software is built over the Selenium and Appium automation frameworks, making testing convenient and code-free.
This blog goes through the steps to customise execution logs for debugging, and to view and edit captured screenshot settings.

Viewing and Customising Execution Log for Debugging
Viewing Execution Log
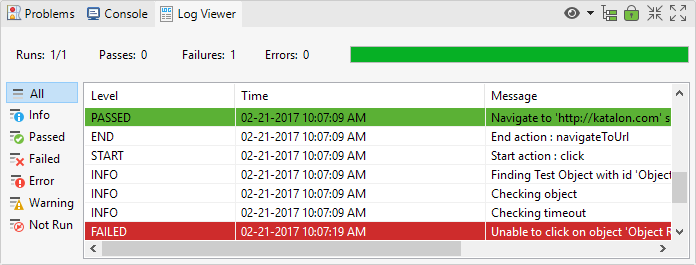
After finishing the test case execution, you can review your results in the Log Viewer views.
You can specify the specific logs to be displayed by applying filters.
Tabular vs Tree View
You can view the Log Viewer in two modes: tabular and tree.

The tree view displays the logs in a more structural way. Users can also navigate to any step by selecting it from the context menu:

Scroll Lock
During the execution of the test, the Log Viewer, is constantly updated, with the most recent messages at the bottom. Hence the Log Viewer will keep scrolling down during the execution. To prevent this, you can enable Scroll Lock to stop automatic scrolling.

Customizing Console Log
Execution Process Debugger
The test log contains all information and detailed actions that were performed during runtime. All step statements and desired capabilities information are also included. For easy visualisation and execution, the log levels are ANSI colour-coded based on different levels: INFO, DEBUG, WARNING, ERROR etc.

You can get the status of the recent tests from the Status Bar in the Log View. It will be GREEN for tests with a passed status and RED to indicate some kind of failure or error.

Web Service Testing: Extensive Logs
Katalon Studio includes the HAR file version 5.9 onwards in Web Service Execution’s log. This file contains low-level data that helps you identify critical performance issues quickly.
When a request is sent, a relative .har file is recorded that is accessible from execution logs. This file will be stored on the current executed machine.

When you execute Web Service Suits, the .har files are stored in the requests’ main folder.

The .har file should be used in services analyser like https://toolbox.googleapps.com/apps/har_analyzer/ as they provide a good insight into the Web Service Request and Response. This aids quick identification of key issues and helps in the efficient allocation of resources. Some issues that are commonly identified are:
- Slow loading of pages, timeouts during task execution
-
Incorrect page formats with missing information
Log Configurations
When you need more log details than the DEBUG level, use the TRACE level. The log details can also be reduced by using the INFO level.
If you want to change the log’s level of the package(s), go to Include> Config > log.properties.

You’ll notice the difference after uncommenting the logging.level.com.kms=TRACE line.
BEFORE:

AFTER:

Executed Test Steps
You can disable Log Executed test steps version 7.0 onwards of the Katalon Studio. For this, go to Project Settings > Executions. Disable the option to exclude the executed test steps.
ENABLED:

DISABLED:


 8+ registered

