Do you think IIT Guwahati certified course can help you in your career?
Introduction
Due to the rapid boom of big data, deep learning is gaining rage worldwide. Deep learning can perform complex tasks based on past data and produce accurate results. Visual models are a type of deep learning model which interpret visual data. They are widely used in image detection, pattern recognition, and other visual tasks.
In this blog, we will be visualizing vision models in the Keras library in Python. So without any further wait, let’s start learning!
What are Deep Learning Models?
Deep learning is a subset of machine learning. It is a field that learns through computer algorithms to improve its performance. Deep learning works with neural networks, which are trained to imitate how humans think and understand.
Deep learning models are highly accurate and can classify images, text, etc., from given data. These models are trained on large data with various algorithms and neural networks containing multiple layers.
Summarizing a Model
In Keras, the summary() method is used to generate the summary of the provided model. It returns a string which contains a detailed summary of the model.
The summary() method provides a textual overview about:
The number of layers and their order in the model.
The shape of each layer and the number of weights present in each layer.
The total number of parameters present in the model.
Example
Let us now create a basic neural network using Keras to summarize it using the summary() method.
Code
#Importing libraries
from keras.models import Sequential
from keras.layers import Dense

#Creating a simple sequential model
model = Sequential()
model.add(Dense(2, input_dim=1, activation='relu'))
model.add(Dense(1, activation='sigmoid'))
model.add(Dense(2, activation='softmax'))

#Calling summary method
print(model.summary())
You can also try this code with Online Python Compiler
In the above example, we imported the sequential class and dense layer from Keras. Then we created a simple sequential model in which we added three dense layers with various activation functions. Finally, we called the summary() method on the model, which gives us the overall summary of the model structure.
Visualizing a Model
Visualizing neural networks is very vital as it can help us to understand the structure and links inside the neural network. Simple models can be visualized easily, but when complex models are used, then visualization becomes very difficult. In this scenario, we can use various methods available in the Keras library.
The below methods can be used to visualize the model in Keras:
plot_model() method
Using Visualkeras
Let us now discuss both methods one by one.
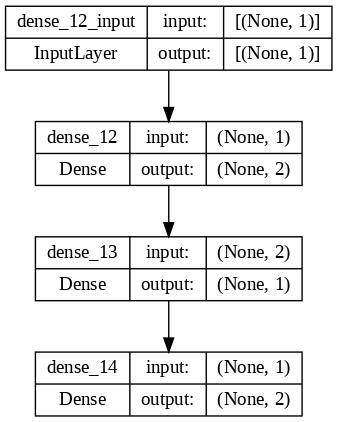
Using plot_model() method
The plot_model() method is available in tensorflow.keras.utils module. It allows you to plot and visualize any Keras module.
In the above example, we imported the plot_model() from keras.utils. After that, we plotted our model with the required parameters for the plot_model() method and got our required result.
Using Visualkeras
The visualkeras is an open-source Python library used to visualize neural network models. It supports a layered and graph-type architecture of neural networks, and thus it is ideal for CNN models. Let’s see the command to install visualkeras.
Command
pip install visualkeras
You can also try this code with Online Python Compiler
Similarly, there are other features available in the visualkeras library for you to explore.
Frequently Asked Questions
What is Keras?
Keras is an open-source deep learning library in Python. It provides high-level neural network API to build deep learning models.
Why do we need to visualize models in Keras?
Visualizing models helps us understand the model architecture better, allowing us to analyze and optimize our model easily.
How to visualize models in Keras?
The plot_model() method in Keras is used to create a visual sketch of models giving explicit info about their layers and links.
What is the summary() method in Python?
The summary() method in Python is a method which is used to get a detailed overview of a model or data frame.
Conclusion
This article discusses the topic of visualizing vision models in Keras. We discussed different methods through which we can visualize a deep learning model in Python. We hope this blog has helped you enhance your knowledge of visualizing vision models in Keras. If you want to learn more, then check out our articles.
But suppose you have just started your learning process and are looking for questions from tech giants like Amazon, Microsoft, Uber, etc. In that case, you must look at the problems, interview experiences, and interview bundles for placement preparations.
However, you may consider our paid courses to give your career an edge over others!


 8+ registered

