


Introduction
When we refer to the term, Troubleshooting Requests, you can break it into two, which are, Trouble and shooting. Now, it is much easier to determine the meaning of the term. Troubleshooting means trouble solving, which is often applied to repair failed products or processes. It becomes very necessary to find the problem and solve it if the product is not behaving the way it is expected to.

In this blog, we will take into reference requests in Postman and discuss various terms and aspects related to Troubleshooting requests in Postman. We will learn how to debug in the console, various common issues, and how to get help from the Postman forum in case of serious mishappenings.

Troubleshooting Requests
If your API request is not working the way it is expected to, there is a problem with that API request. There can be many possible reasons for it. To identify the problem, you have the option to use the Postman Console so that you can troubleshoot your request. If that does not help, you can communicate with the Postman Help Forum and get your work done. We will discuss both these ways in the blog further.

Requests’ building is one of the most important topics when learning the Postman. Whether it be building a web application, adding some details, or modifying it as per the Client’s requirements, you need to build requests every time.
Requests generated can help developers post links to APIs. This can help them recover, join, delete, or update any information or data. In this way, they can build and test the APIs and can also form integration with a third-party API.
How to Identify Problems
Problem Identification is not a very big concern when it comes to the requests in the Postman. Postman will help you see any whitespace or faulty characters in some portions of the request that may not work as expected.
In this way, it helps the programmers to understand and improve the entered requests, URLs, parameters, and body. To accomplish the details describing the errors, developers are expected to click the View in Console option simply. This will generate the summary of the request and find the source of the problem.
Debugging in the Console
You need to know that each and every request sent by Postman is logged in the Console. In this way, you can view the details of what happens when you generate a request in Postman. In this way, it is implied that you can use the Console to help you debug the request when an API is not behaving the way it is anticipated to. Postman Console also helps you increase the network calls and log messages visibility while you debug any request.

Console Composition
The Postman Console contains following information that helps you debug your requests.
- The Primary Request
- The Proxy Configuration and Requests
- Network Information
- Log Statements and Asynchronous Requests
- The Raw Response
Opening the Console
There are two ways in which you can open the Console. Either you can simply select Console from the footer of the Postman Window, or you can press Ctrl+Alt+C to open the Console Window.
Viewing Request Errors
An error message is generated every time Postman is not enabled to send your request further. Also, if the developer does not get a response from the API, it has sent the request, which Postman generates an error message. The error message generated consists of an overview of the issue and a link to the Postman Console through which you can get detailed information about the request.
Click on the View in Console option for inspection of the request details and to find out what did not go right.
Navigating the Console
The Console consists of network information, response and request headers and body for every request, and console output messages coming from your test scripts.
You can filter the log message type by clicking on the All Logs option. Use the more actions icon so as to turn timestamps or network information on or off. The Console logs past 5000 messages and 24 hours by default. Use the Clear option anytime to empty the Console from timestamps and network information.
Using Log Statements
The Log Statements are certain specific statements used at appropriate locations in your test scripts. These statements can help you in debugging your requests. There are four log statements that are accepted by the Postman. You can refer to the list below to have a look.
- console.log()
- console.info()
- console.warn()
- console.error()
Common Issues
When you send a request, there can arise an issue. Some common issues with sending a request, along with some resolutions, are given below in the table. If any such issue is not in the list below, you can refer to the Getting Help section of this blog.
Common Issues |
Resolution |
| Connectivity | Check your connection. |
| Firewalls | Contact your network administrators. |
| Proxy Configuration | Have a look at your network’s proxy settings. If that does not help, use the Postman Console for debugging. |
| SSL Certificates | Turn off the SSL Certificate Verification from the settings. If that does not help, use the Postman Console to ensure that the correct SSL Certificate is being sent. |
| Client Certificates | Have a look at the Certificates section of Postman Settings. |
| Incorrect Request URLs | Open the console to check if the request URLs are correct or not. |
| Incorrect Protocol | Check for the correct format. |
| Short Timeouts | Increase the Timeout from postman Settings. |
| Invalid Responses | Make sure that the response and headers are correct and proper. |
| TLS Version | TLS version 1.2 and higher is supported. |
| Postman Errors | Firstly, check your server logs. If that does not help, use the Github Issue Tracker. |
| Unresolved Variables | Try avoiding it by reading more about it. |
Troubleshooting App Issues
You can also face some issues with the Postman App. If you are facing such trouble, several resources may help you diagnose and fix such issues, each of which will be discussed below.
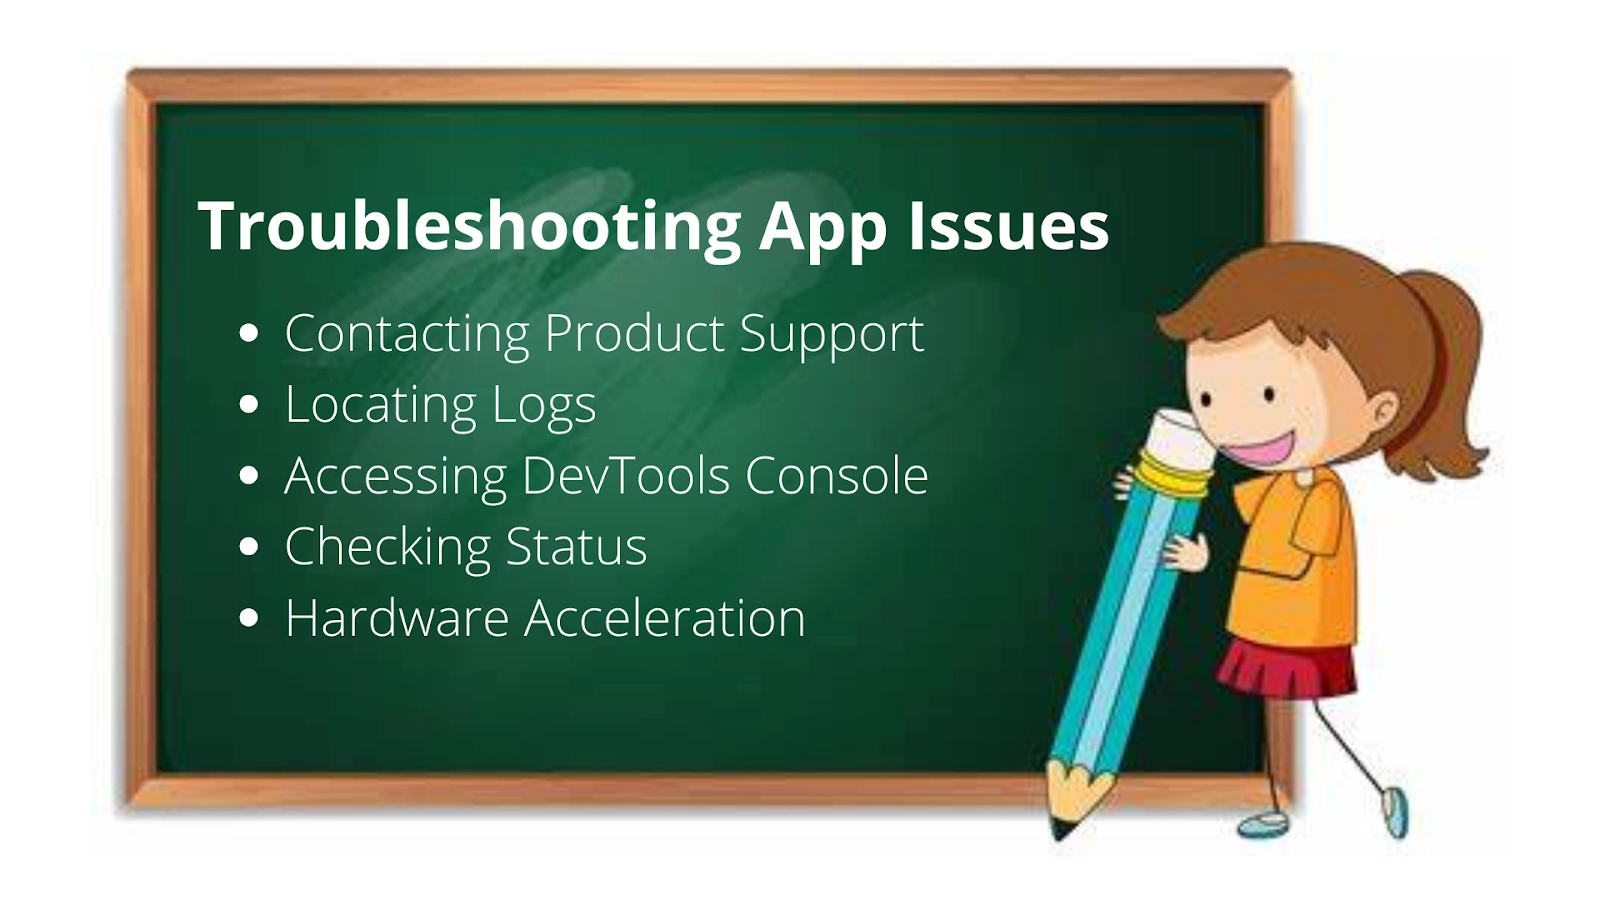
Contacting Product Support
The help from Product Support is the ultimate thing one could resort to. You will always have an option of contacting Product Support if you need help in resolving any issue that may have arisen.
Locating Logs
Capturing log messages is the automated feature offered by Postman. The log messages are captured in the event if something has gone wrong. It includes information regarding the recent activities in the app and might be useful for troubleshooting requests’ issues.
🌻 Locating Logs in MacOS: Open Postman and go toView>Developer>View Logs in Finder.
🌻 Locating Logs in Windows: Open Postman and go toView>Developer>View Logs in Explorer.
🌻 Locating Logs in Linux: Open Postman and go to View>Developer>View Logs in File Manager.
Accessing DevTools Console
The DevTools Console contains internal debugging entries, which will be useful in troubleshooting requests’ problems with the Postman app.
To access the DevTools Console log, follow these steps mentioned in the image below.
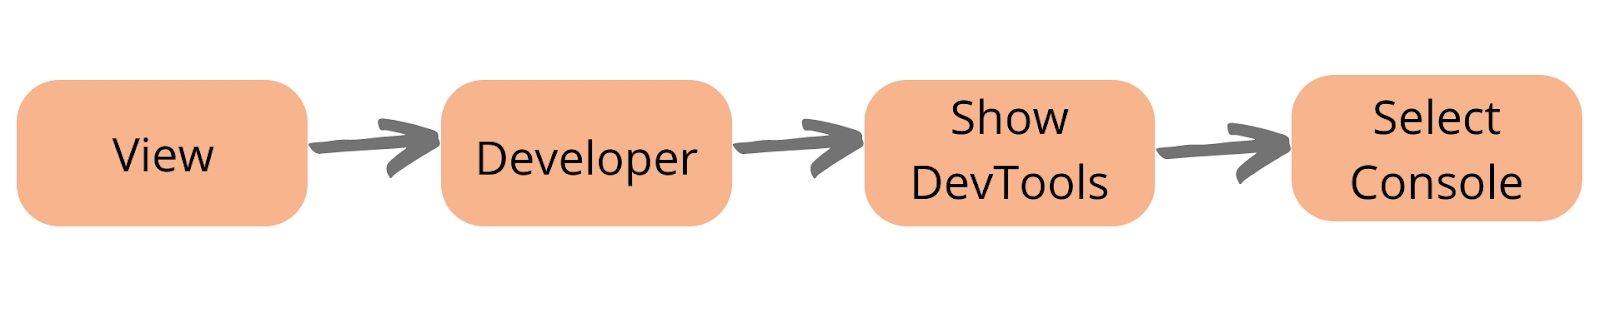
The Console in the DevTools window will help you access the app debug logs.
Checking Status
A user always has the option to check the Postman Status page. The Postman Status page contains information about degraded information, outages, or is undergoing some maintenance.
Hardware Acceleration
Postman uses the computer’s built-in graphics hardware to its advantage. This helps Postman to speed up the rendering of the onscreen graphics. If you are facing issues with screen artifacts or glitches in the screen, turning off the hardware acceleration might help you solve the problem.
Getting Help!

If, even after all your efforts, you still face problems with your requests, you always have the option of getting help. There are a few options available for your help. These are:
🌻 Community Help from the Postman Forum
🌻 Using the Issue Tracker
🌻 Private Help from Postman Support


 9+ registered

