Do you think IIT Guwahati certified course can help you in your career?
Introduction
Bugs are issues or errors in your software applications that make them behave incorrectly. They can occur due to design flaws, programming errors, or ambiguous project requirements. Dealing with bugs is known as Debugging, and itis an integral part of the software development lifecycle.
Debugging is the process of dealing with bugs by identifying, analyzing, and fixing them using various methods. In this article, you will learn about debugging, types of bugs, and more.
Let’s get started.
Common Bugs in Software Development
You can face different bugs when developing applications or writing code in general. Some of these bugs are briefly discussed below:-
Syntax Errors
These errors occur when your code doesn’t follow the syntax rules of the programming languages you using. They are relatively easy to fix as modern code editors provide advanced features such as code completion and linting.
Memory Leaks
Memory leaks occur when your application fails to release unused memory, which leads to the depletion of available memory. They are common in applications that are built with languages that don’t have automatic garbage collection, such as C and C++.
Concurrency Issues
Race conditions and deadlocks are common bugs in multithreaded applications. It occurs because the order of thread execution is not fixed and can vary across different instances of the same application, making these issues tough to detect and reproduce.
Input Validation Issues
SQL Injection and cross-site scripting(XSS) attacks are usually initiated through unsanitized user input forms, so it is important to validate any user-submitted data to protect your application against these attacks.
Runtime Errors
These errors occur while your application is being used, which can cause it to crash or behave unexpectedly. It can happen due to many reasons:-
Null pointer reference
Out-of-bounds array access
Division by zero
Invalid user inputs, etc.
Now, we will discuss a brief overview of the debugging process.
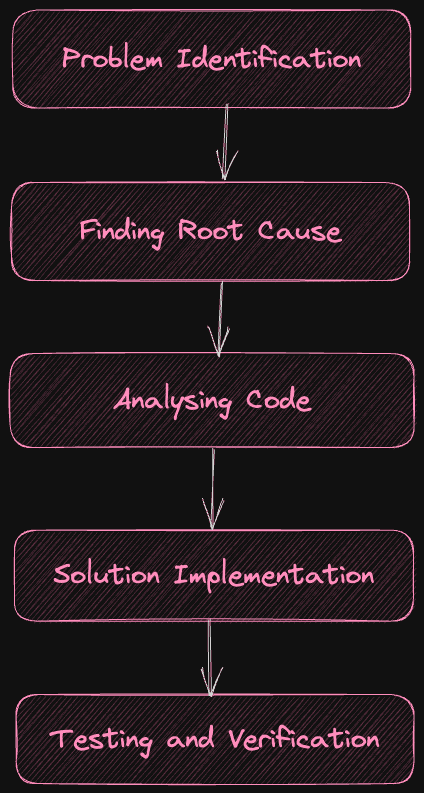
Debugging is a systematic and organized process that helps you find and resolve bugs in your software applications. Let’s see an overview of some key stages of this process:-
Problem Identification
Debugging starts with identifying unexpected behavior in your software. It can be crashes, incorrect results, or deviations from the expected functionality. You can identify these from user reports, error messages, and testing techniques.
Finding the Root Cause
Once you have identified a bug, you should start looking for some potential sections of code that may be causing the issue. You can use debugging methods like breakpoints, logging, and tracing to pinpoint the root cause. We will discuss some of these methods in later sections.
Analyzing Code
After the code section that is causing issues has been found, you should start analyzing it by tracing its execution path and examining how it interacts with the other components of your code.
Solution Implementation
In this stage, a potential solution is implemented to fix the bug by modifying existing code or adding code for missing functionality. You can also adjust algorithms to fix performance-related issues.
Testing and Verification
You should do rigorous testing after implementing a solution to ensure the bug is fixed and you haven’t introduced any additional bugs.
Before learning about the commonly used techniques for debugging, let’s see some best practices that you can incorporate into your code to avoid creating any bugs in the first place.
Debugging Strategies
Following are the debugging strategies:
Print Statement Debugging: Inserting print statements at strategic points in the code to output variable values and execution flow, aiding in understanding program behavior.
Logging: Utilizing logging frameworks to record relevant information during program execution, providing insights into the sequence of events and potential issues.
Interactive Debugging: Employing interactive debugging tools provided by integrated development environments (IDEs) to set breakpoints, inspect variables, and step through code execution.
Code Review: Collaborating with peers for code reviews, leveraging fresh perspectives to identify errors, inefficiencies, or logical flaws.
Unit Testing: Implementing unit tests to systematically validate individual components of the code, helping detect issues early in the development process.
Regression Testing: Running previously passed tests to identify regressions, ensuring that new changes do not introduce unintended side effects.
Rubber Duck Debugging: Explaining the code or problem aloud to a non-technical entity or an inanimate object, forcing a deeper understanding and potential self-discovery of issues.
Code Profiling: Using profiling tools to analyze code performance, identify bottlenecks, and optimize resource usage.
Binary Search Debugging: Narrowing down the search for bugs by iteratively testing halves of the codebase until the problematic section is identified.
Exception Handling: Implementing robust exception handling to gracefully capture and handle errors, preventing program crashes and providing detailed error information.
Code Annotations: Adding comments and annotations to the code for better documentation and clarity, aiding both the developer and potential reviewers.
Version Control: Utilizing version control systems to track changes, revert to a stable state, and collaborate effectively in a team environment.
Pair Programming: Collaboratively working with another developer in real-time, promoting continuous feedback and quicker issue identification.
Best Practices to Avoid Bugs
Writing clean and manageable code is key to avoiding bugs. Let’s discuss some coding principles that simplify developing and maintaining software applications.
SOLID Principles
SOLID principles are a set of five design principles for object-oriented programming that enhance code quality and maintainability. The principles are listed below:-
Single Responsibility Principle: Each class should only have one reason to change.
Open/Closed Principle: Classes should be open for extension but closed for modification. This principle allows you to add functionality without changing the existing code, which may have created new bugs.
Liskov Substitution Principle: Objects of a base class should be replaceable with objects of their child classes without affecting the correctness of the program.
Interface Segregation Principle: Classes should only implement those methods they actually need.
Dependency Inversion Principle: High-level classes should not depend on the implementation details of the low-level classes.
DRY Principle
DRY stands for “Don’t Repeat Yourself.” This principle encourages you to avoid duplicating code or logic in your application. Instead of repeating the same code multiple times, you should centralize it in a single reusable location. The goal of this principle is to improve code maintainability. Also, repeating the same code across multiple places in your project can lead to inconsistencies.
KISS Principle
KISS stands for “Keep It Simple, Stupid”. The idea behind this principle is to avoid adding unnecessary complexity to your codebase. It encourages you to add complexity only when it is necessary. This principle makes maintaining and extending your code easy due to its simplicity.
These principles are merely guidelines that can help you write bug-free code, but they don’t guarantee it, making it important to learn about debugging and some of its commonly used techniques.
Now, let’s discuss some commonly used debugging techniques in software development.
Common Debugging Techniques
There are many debugging techniques used in software development, and some commonly used ones are listed below:-
Print Statements
Printing statements to the console is a straightforward way of examining the control flow of your programs. You can use functions such as “console.log()” or “print()” depending on your programming language.
Let’s see an example that uses print statements to debug C++ code.
C++
C++
#include <iostream>
#include <vector>

using namespace std;

int main() {

    vector<vector<int>> mat = {

        {1, 2, 3, 4},

        {5, 6, 7, 8},

        {9, 10, 11, 12}

    };


    for(int i=0; i<mat.size(); i++){

        for(int j=0; j<mat.size(); j++){

            cout<<mat[i][j]<<" ";

        }

        cout<<"\n";

    }


    return 0;

}
You can also try this code with Online C++ Compiler
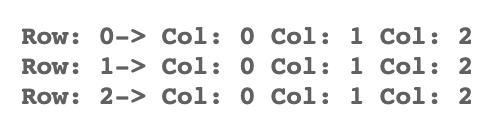
We can see in the output that some elements from the matrix are not being printed. To fix this, we will try to track the index values with “cout<<” statements.
It is clear from the output that the value of j never becomes equal to the last column. The source of this bug can be linked with the condition of the inner for-loop, as it is the only part in our code that modifies the value of j. The inner for-loop breaks when j becomes equal to ‘mat.size()’. Instead, it should break after j reaches ‘mat[0].size()’.
You can set breakpoints on specific lines of code where you want your program to pause. While it is paused, you can easily inspect the values of variables and objects, making it easy for you to perform debugging.
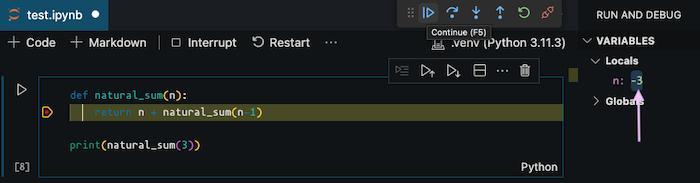
Let’s look at an example that uses breakpoints in VSCode to debug a recursive function in a Python notebook.
Python
Python
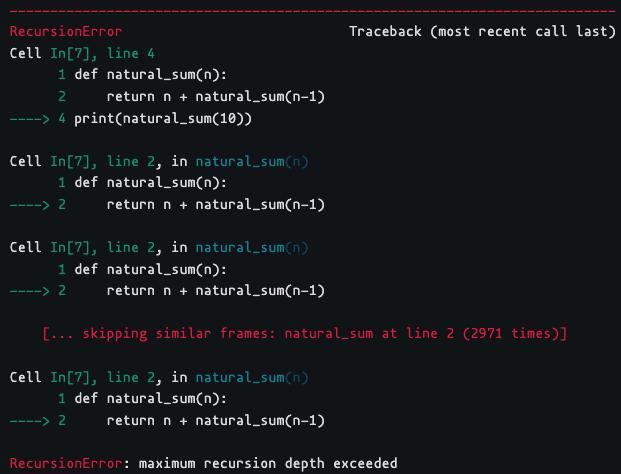
def natural_sum(n):
    return n + natural_sum(n-1)

print(natural_sum(3))
You can also try this code with Online Python Compiler
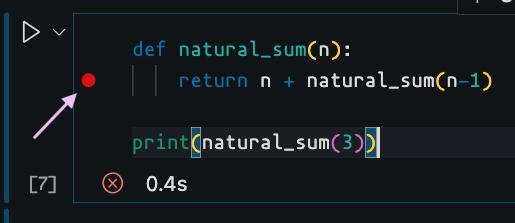
At its current state, our code exceeds the stack memory limit, which leads to RecursionError. We will add a breakpoint on the return statement of the recursive function and run the cell in debugging mode.
Program execution will be paused at each recursive call. This makes it easy to examine the value of n.
As you can see, the n keeps getting decremented until the stack memory of our program is exhausted. We can quickly fix this bug by adding a base condition to our code.
Python
Python
def natural_sum(n):

    if(n==0): return 0 #base condition

    return n + natural_sum(n-1)

print(natural_sum(3))
You can also try this code with Online Python Compiler
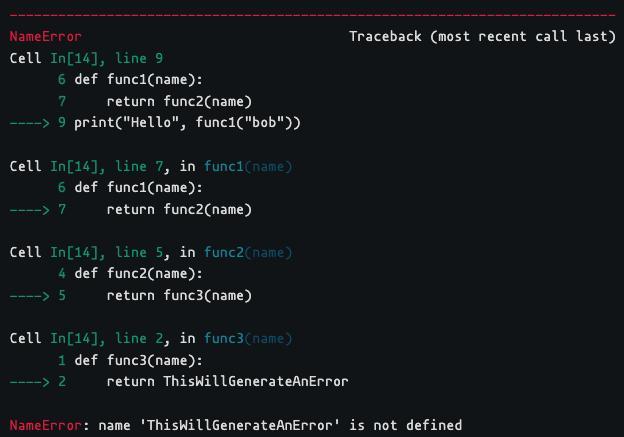
Many frameworks and languages provide a call stack trace when a runtime error occurs. The stack trace is a report that shows the sequence of function calls that led to an error.
Let’s see how Python provides a call stack trace.
Python
Python
def func3(name):

    return ThisWillGenerateAnError # fix this by returning the name

def func2(name):

    return func3(name)

def func1(name):

    return func2(name)

print("Hello", func1("bob"))
You can also try this code with Online Python Compiler
The generated stack trace allows us to pinpoint the code section that failed during execution.
Reading Documentation
When working with unfamiliar libraries or frameworks, referring to the official documentation is essential to ensure you use its features correctly. You can avoid many hours of debugging with this. Documentations also provide you with guidance on best practices and framework-specific conventions.
Now that you are familiar with debugging, let’s look at a real-world example.
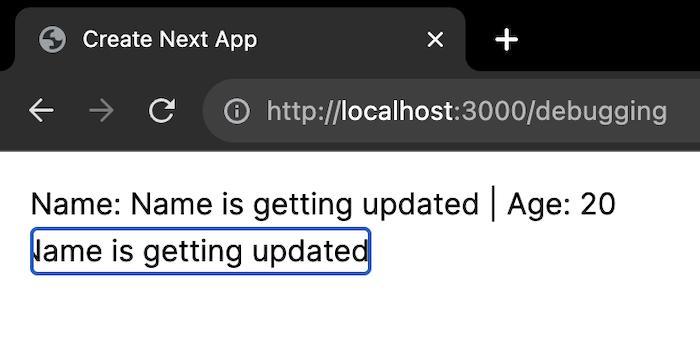
Debugging a Page in Next.js
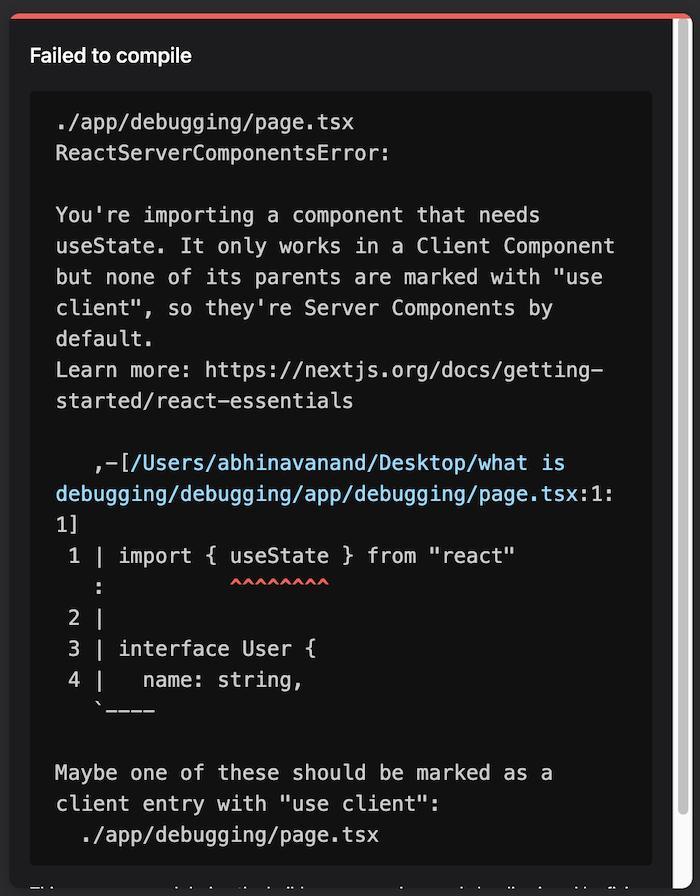
The following page corresponds to a route in our application, which should display the user data and an input field that changes the user name. However, this component has some bugs, which makes it unusable.
The following error message appears when we try to visit this page.
This error occurs because Next.js uses server components by default, and we cannot initialize state values in them. To fix this, we must use the “use client” directive at the top of this component. This error could have easily been avoided by properly reading the documentation before implementing this page.
"use client";
import { useState } from "react"
//rest of the code remains same
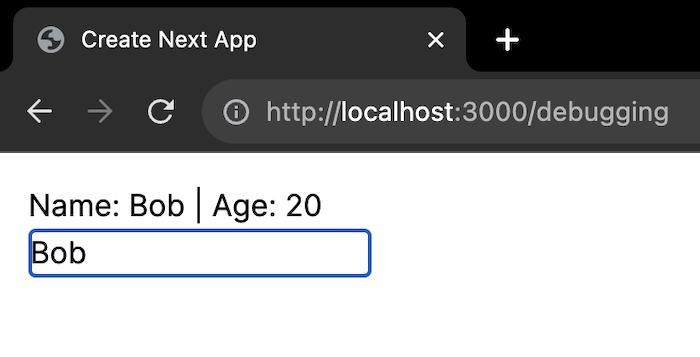
The previous error has been fixed, but now we have a new bug – typing doesn’t change the user name and the text within the input field.
In our component, the handleChange() function updates the user name, so we can easily pinpoint this as the root cause of this bug. After a quick look, you can see that this function directly modifies the state object and then calls the setData() function to update the state. However, React doesn’t detect this as a state change because it uses shallow comparisons, and the memory reference of the object has not changed. To fix this, we have to provide a function to the setData() function that computes the new state based on the previous state values.
Let’s see the updated implementation of the handleChange() function.
Error Identification: Debugging is crucial for identifying and fixing errors, including logical bugs, syntax errors, and runtime issues, ensuring the software functions as intended.
Improved Code Quality: Debugging contributes to better code quality by eliminating defects, enhancing the overall reliability and robustness of the software.
Enhanced Developer Productivity: Swift and effective debugging reduces development time, enabling developers to focus on creating features rather than troubleshooting issues.
Optimized Performance: Debugging aids in identifying performance bottlenecks and optimizing code, resulting in improved efficiency and responsiveness of the software.
Increased Software Stability: By addressing and resolving bugs, debugging leads to increased stability, minimizing the likelihood of crashes or unexpected behavior during execution.
Automated Debugging
Automated debugging refers to the use of specialized tools and technologies to streamline the process of identifying and rectifying software defects without heavy reliance on manual intervention. This approach leverages various techniques, such as static and dynamic analysis, integrated development environments (IDEs), and automated testing frameworks. Static analysis tools scrutinize source code without executing it, identifying potential issues based on code patterns and structure.
Dynamic analysis tools, on the other hand, assess software during runtime, pinpointing problems like memory leaks and unexpected behaviors. Integrated Development Environments provide built-in debugging tools, aiding developers in real-time issue identification and resolution.
Frequently Asked Questions
What do you mean by debugging?
Debugging is the process of identifying, analyzing, and fixing errors or defects in software code to ensure proper functionality and behavior.
What do you mean by debugging of OS?
Debugging an operating system involves identifying and resolving issues or errors within the OS code to enhance stability, security, and overall performance.
What are the 4 steps of debugging?
The four steps of debugging include reproduction (identifying the issue), isolation (narrowing down the cause), correction (fixing the error), and verification (ensuring the fix is effective).
Conclusion
In this article, you learned about debugging in software development. We discussed some best practices that can help us avoid bugs. We also looked at some commonly used techniques for debugging. In the last section, we fixed some bugs in a Next.js page.
Read the following articles to learn more about debugging:-


 9+ registered

