Regression is a data mining technique that is used to model the relationship between a dependent variable and some independent variables. This relationship is then used to predict future values of the independent variables.
In this blog, we will discuss Regression in Data Mining in detail. We will discuss the different types of Regression in Data Mining. We will also see some common applications of Regression. In the next section, we will discuss Regression in detail.
Regression in Data Mining
As already told in the previous section, Regression in Data mining is a technique to establish a relationship between a dependent variable and some independent variables. The dependent variable is also called the response variable, and the independent variable is also called the predictor variable. We will make use of these terms quite often in the upcoming sections.
Let's try to understand it better with an example. Let's say the price of a car depends on its horsepower, number of seats and its top speed. In this example the car becomes the dependent variable whereas the horsepower, number of seats and the top speed are all independent variables. If we have a data record containing previous records of the price of cars with their features, we can build a regression model to predict the price of a car depending on its horsepower, number of seats and the top speed.
Types of Regression in Data Mining
Now that we know about Regression, let us see the various types of Regression in data mining. Although many regression models exist, some of the most common models are discussed below.
- Linear Regression
- Polynomial Regression
- Logistic Regression
- Ridge Regression
- Lasso Regression
Lets understand them in detail
1. Linear Regression
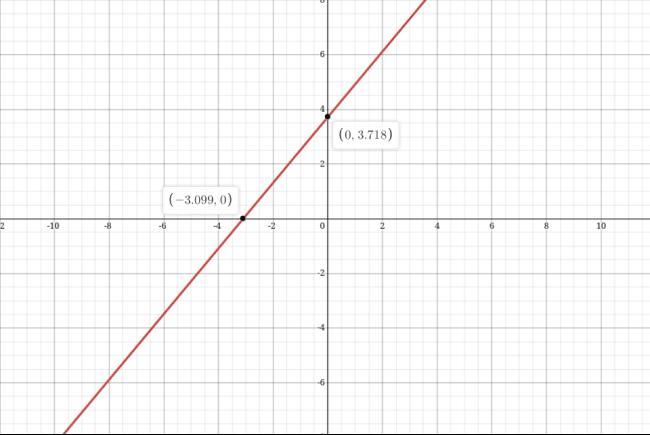
Linear Regression is the most basic type of Regression in data mining. This regression model assumes that the dependent variable has a linear relationship with the independent variables. Like any other regression model, linear Regression aims to find the best-fitting curve for predicting future values.
The general equation of a linear regression model is given by:
y = a1.x + a2 + e
In this equation, a1 is the slope, a2 is the intercept, and e is the error quantity. The slope indicates the rate of change of the dependent variable w.r.t the difference in the independent quantities. In contrast, the intercept indicates the value of the dependent variable when the independent variable is zero. The graph of a linear regression model looks like this.
2. Polynomial Regression
In polynomial Regression, the relation between the dependent and the independent variable is assumed as a polynomial of nth degree where n is in the range from [2, infinity].In real life, the relationship between variables is generally polynomial. Higher the degree of the polynomial, the more accurate it is.
The general equation of polynomial Regression looks like this.
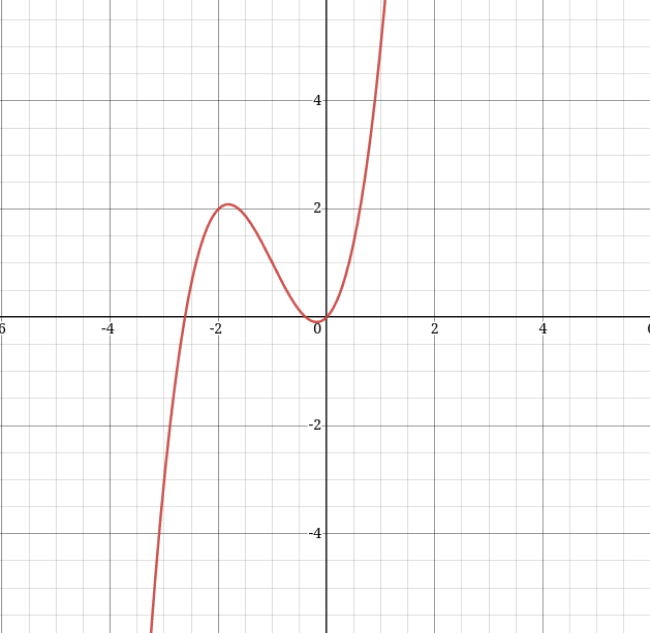
y = a0 + a1x + a2x^2 + a3x^3
This is a polynomial equation of 3rd degree. Here a0, a1, a2, and a3 are the coefficients. The sample graph of a polynomial regression is given below.
3. Logistic Regression
Logistic Regression is generally used when the dependent variable is binary (true or false) or multinomial (low, medium, high). Logistic Regression is a prediction-based technique to predict the probability of the dependent variable based on the values of the independent variable.
The following equation gives the equation of a logistic regression model.
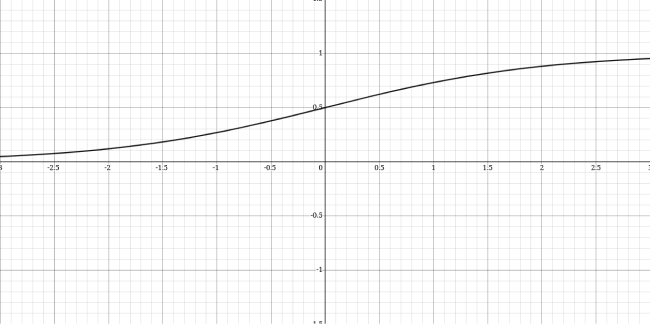
y = 1/(1 + exp(-z))
In this equation, y is the probability of the dependent variable taking the particular value, and z is the combination of independent variables. The value of y lies between 0 and 1. The graph of logistic Regression looks like this.
4. Ridge Regression
Ridge regression is a technique that adds a penalty term to the ordinary least squares cost function. Ridge regression is used to tackle the issue of multicollinearity. Multicollinearity occurs when the independent variables themselves correlate them. By compensating the coefficients in Ridge regression, the effect of multicollinearity can be reduced and make the model more stable.
5. Lasso Regression
Like the Ridge regression, Lasso Regression also adds a penalty term to the ordinary least squares cost function. LASSO stands for Least Absolute Shrinkage and Selection Operator. As the definition suggests, we use Lasso regression to minimize the effects of the coefficient.
The significant difference between Lasso and Ridge regression is how much they can affect the coefficients. While Lasso Regression can effectively reduce the coefficients to zero, ridge regression cannot.

