Do you think IIT Guwahati certified course can help you in your career?
Introduction
Apache JMeter is an open-source load and performance testing software based on Java Language. JMeter was developed by Stefano Mazzocchi of the Apache Software Foundation. It was primarily written to load and test the performance of Apache JServ (also called the Apache Tomcat project). Later on, to add more features and functional testing capabilities, the Apache community redesigned it to enhance the GUI. Its functionalities have grown to include testing web pages, web apps, and other static and dynamic resources like databases, Lightweight directory access protocol (LDAP), Java objects, rest web services, and more.
When a production service fails, application monitoring notifies developers and provides information to identify the cause. This article will outline how to implement JMeter as a component of your monitoring workflow and integrate JMeter monitoring into your testing practice.
About Monitor test Plan in Jmeter
JMeter listeners allow viewing the results in different formats-
Each test plan should have at least one listener to check the execution results. One such listener is Monitor Results. Using this monitor result, you can see the status of the sample received by the monitor, and you can also view the server's performance graph.
Features of Monitor Tests
The main features of the Monitor test plan in JMeter include:
Monitors are helpful for system management and stress testing.
The monitor offers further information on server performance when used with stress testing.
Monitors make it simple to see how server performance and client response time are related. With the help of these server/ protocol supports-
The monitor offers a simple way to monitor numerous servers from a single terminal as a system administration tool.
In the case of many monitoring actions, it is possible to split execution between more threads and/or instances. The monitor was initially designed to work with status servlet in Tomcat 5. The status servlet can theoretically be ported to provide the same information in any servlet container that supports JMX (Java Management Extension). Here we will monitor Tomcat 10.0.27 server for our test purpose. So first, we will set up the tomcat server, and then to monitor the tomcat server, we will write the test case.
Setting up Tomcat Server
Apache Tomcat is an HTTP server with Java support that can run specialized Java programs called "Java Servlet" and "Java Server Pages (JSP)." Tomcat is an open-source project managed by the "Apache Software Foundation." The mother site for Tomcat is http://tomcat.apache.org. You can also find Tomcat via the Apache mother site @ http://www.apache.org.
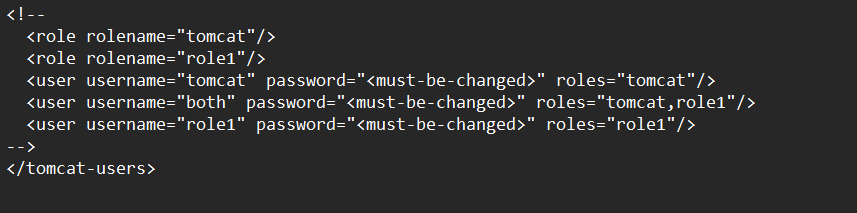
To set up the tomcat server after installation, you need to traverse this path directory- <TOMCAT_HOME>/conf/tomcat-users.xml. Now edit the configuration file for users. This file contains a commented tomcat-users section as shown −
We can edit this section as per our requirements. Here we will add the manager-gui, admin roles, and manager and assign the user "tomcatuser". This edited code will look like this −
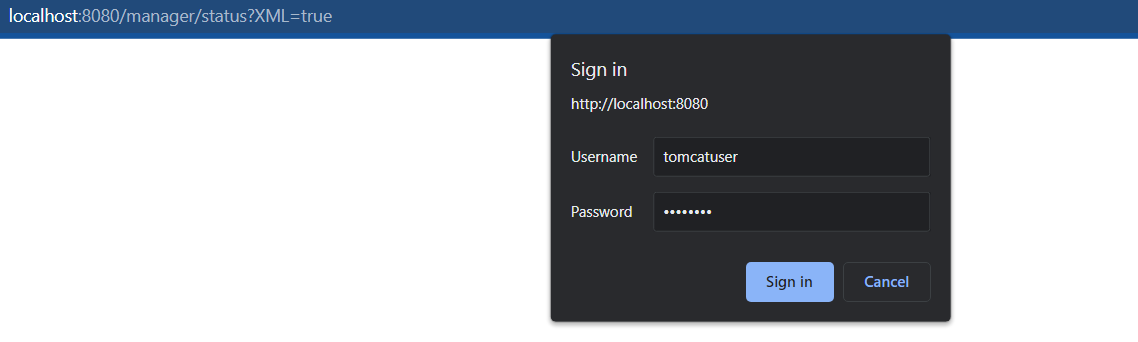
Now start the tomcat server by clicking on the startup file located in the bin folder under the tomcat folder. Once the server is started, you can check its working by entering the following link in your browser −
http://localhost:8080/manager/status?XML=true
An authentication window appears in the browser like this-
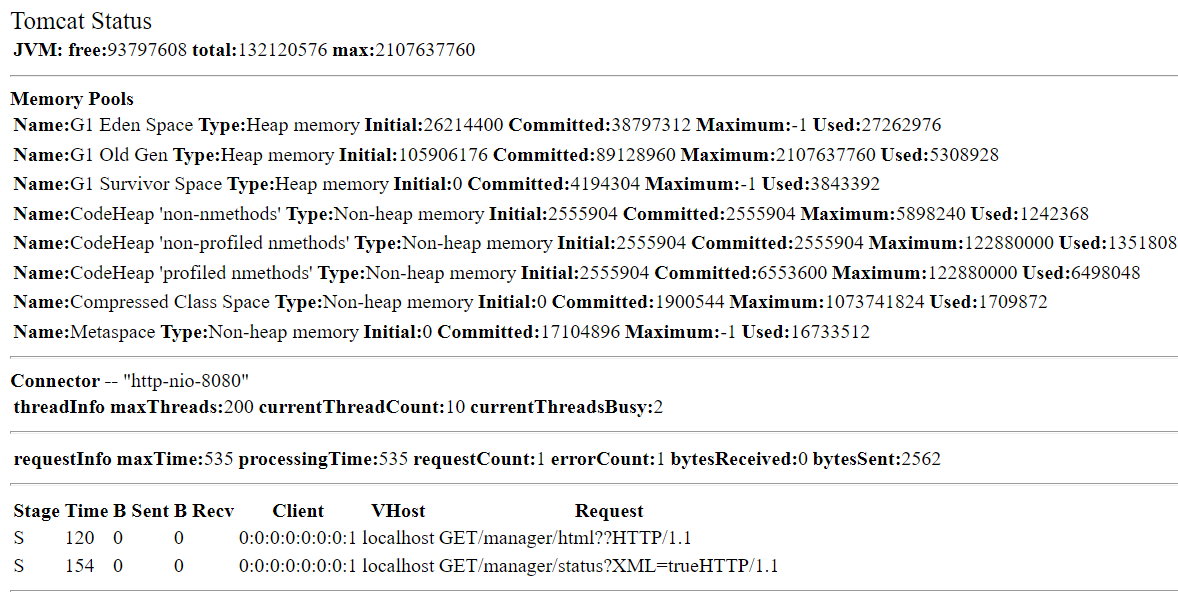
Once the tomcat login and password associated is entered, the browser will show the execution status of Tomcat as below −
Using Monitor test Plan in JMeter
To monitor the Tomcat server, let's start with writing a test plan. We can add a constant timer and listeners(result format) using the JMeter. After that, we can run this test and get the desired result.
Note that the monitor test plan will be available in Jmeter 3.1 or less.
To get a clear picture of the Monitor test Plan, follow the given steps-
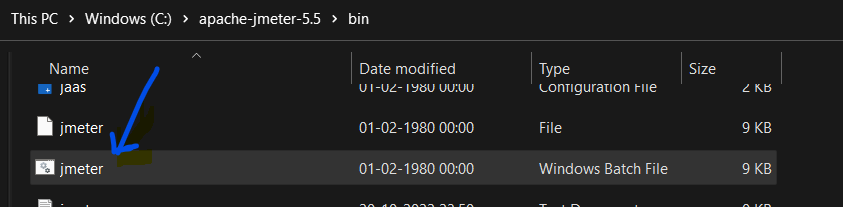
Step 1 : Open the JMeter window by clicking-
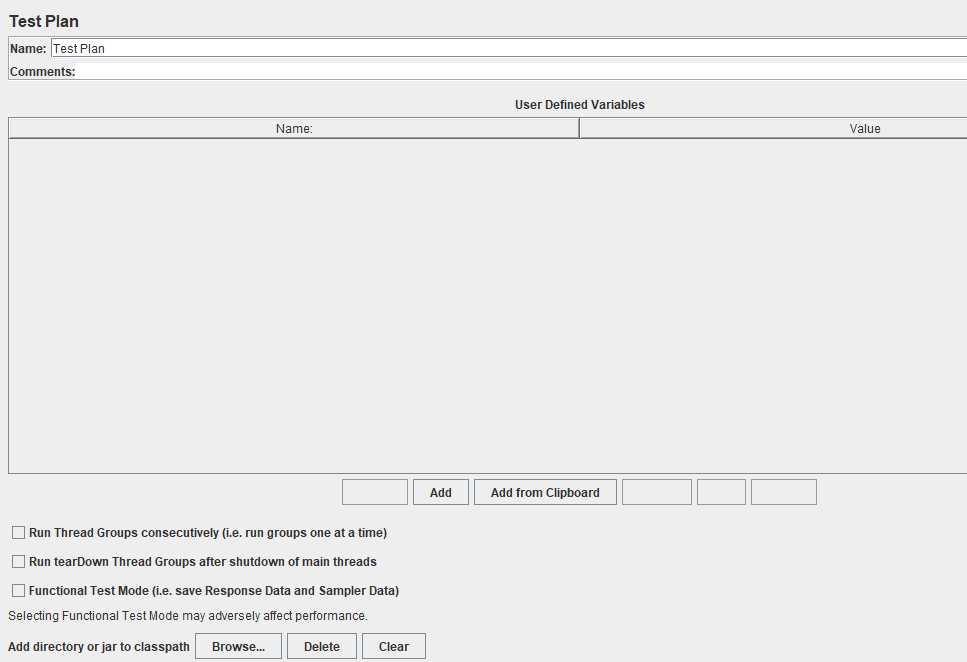
Once you click on the batch file, the Apache JMeter screen will appear as this:
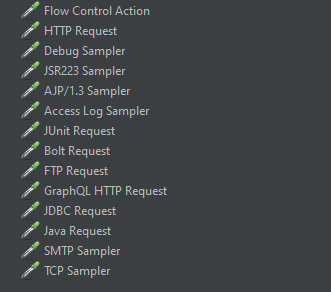
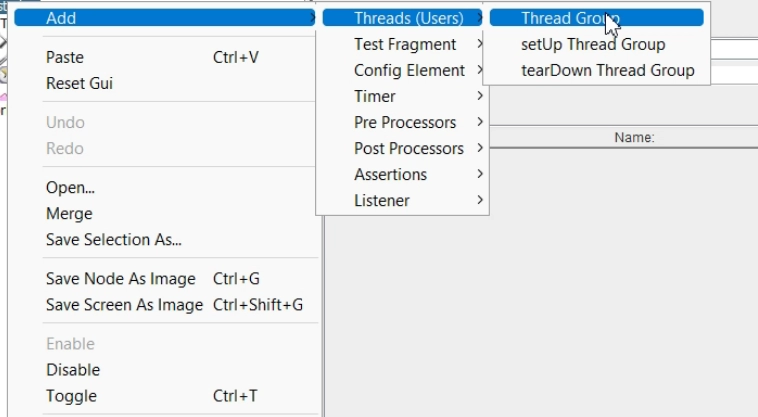
Step 2: The next step is to create the test plan, which acts as a container for running tests, where each test plan must have a minimum of one thread group. So to add the thread group, right-click on test plan option and follow these steps-
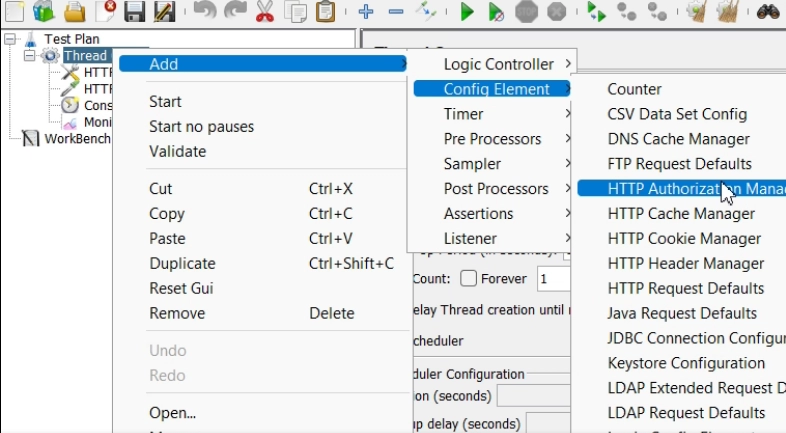
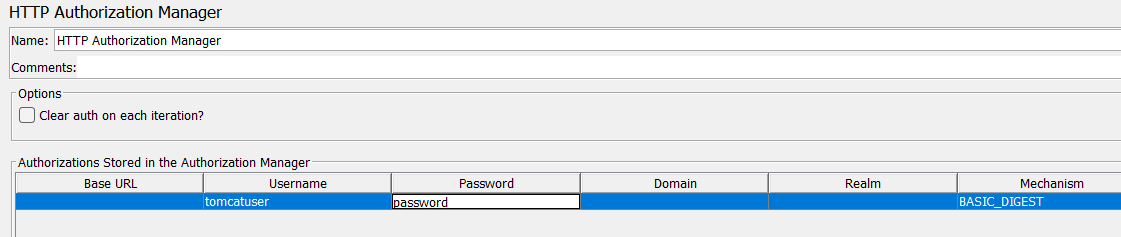
Step 3: Now add the HTTP Authorization Manager to the Thread Group by following the given steps-
To see the Tomcat server status, the HTTP Authorization Manager manages authentication requested by the browser. For that you need to provide the Username and Password depending on the configuration in tomcat-users.xml file.
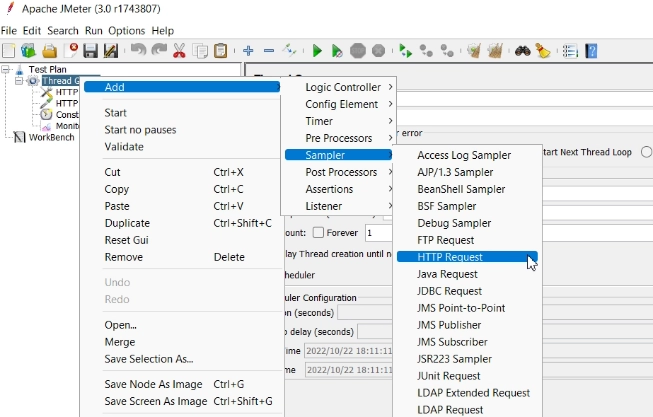
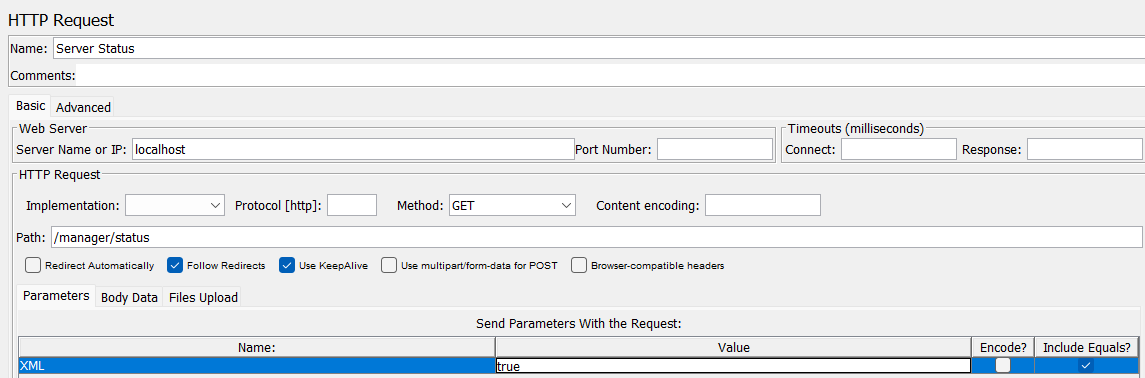
Step 4: Add the Jmeter HTTP Request sampler.
Fill the parameters as given-
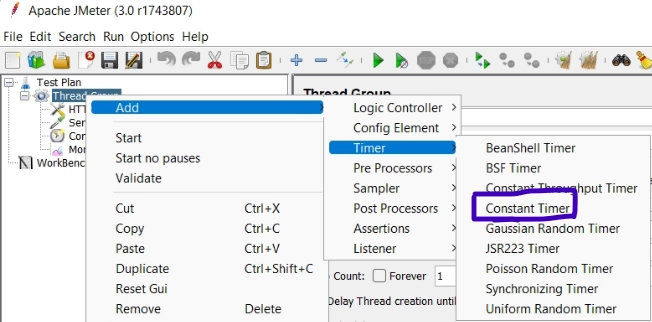
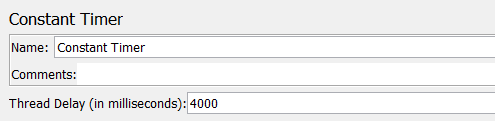
Step 5: The next step is to add the timer. Here you can use the constant timer. To add the timer follow the given steps-
Configure the thread delay of 4000ms.
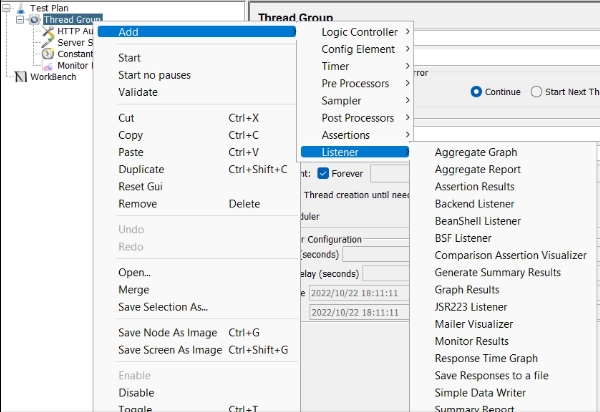
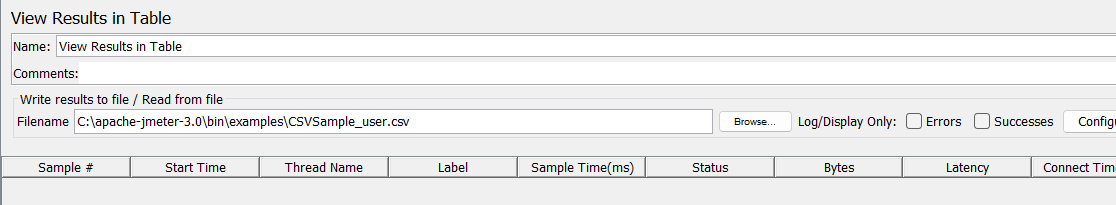
Step 6: Here we are adding two types of listeners. One that displays the test result in table form. To add the listener follow the given step-
Specify the filename and directory of the output file in the listener. As given in the below image-
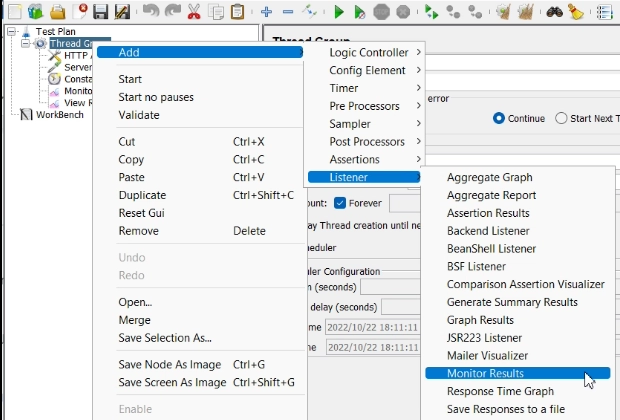
Now let's add another listener by following the given steps-
Step 7: After adding the required output format, save the test plan.
There are total two tabs in the monitor results listener. The first tab is the "Health" tab, which displays the status of the last sample received by the monitor. The second tab is "Performance", which shows a historical view of the server's performance. The performance graph in the above image shows four different lines. The free memory line shows the amount of free memory left in the current allocated block. Tomcat 5 returns the maximum memory, but it is not graphed. In a well-tuned environment, the server should never reach the maximum memory. Note that the graph contains subtitles on both sides. % is on the left, and dead/healthy is on the right. Rapid ups and downs in the memory line could be a sign of memory thrashing. In those circumstances, profiling the application with Borland OptimizeIt or JProbe is a smart idea. A consistent pattern for load, memory, and threads is what you are looking for. Any abnormal behavior typically points to poor performance or a bug of some sort.
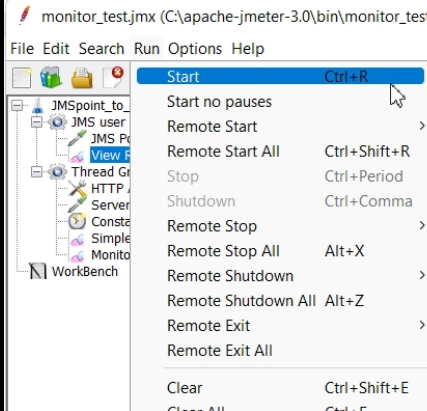
Step 8: Click on the ‘Run’ button on the menu bar. Now you can see the result in graph format in the Monitor result listener as well as in csv file downloaded in the specified directory.
This was all about Monitor test Plan in JMeter, now it’s time for some frequently asked questions on monitor test plan in JMeter.
What is Performance Testing, and why is it important?
Performance testing is non-functional testing that evaluates the application's performance under expected or higher loads. It's done before the app goes live to ensure it doesn't crash and replies in a reasonable amount of time under real-world conditions.
Is the JMeter tool capable of simulating a real browser?
No, JMeter does not replicate or operate the same way as a genuine browser. It cannot render HTML responses as a real browser can.
Describe how JMeter works internally.
JMeter creates numerous threads that make simultaneous requests to a target server to simulate real-world user load. The server's performance is then displayed via tables and graphs.
What is the purpose of the Timer in JMeter?
JMeter can use a timer to delay the time between each request a thread makes. It is capable of resolving the server's overload issue.
Does JMeter require coding?
No, it does not require coding skills. If any script has to be created, that can be done using an inbuilt recorder.
Conclusion
Each and every listener is important in getting responses from the samplers and providing data for analysis, both of which are necessary for performance testing. This article discusses one of such listener-Monitor test Plan in JMeter.
To explore more on JMeter, here are more articles for rescue.


 9+ registered

