


Introduction
The Z-score measures how much a particular value deviates from the standard deviation. The Z-score, also known as the standard score, is the number of standard deviations above or below the mean for a given data point. The standard deviation of a data collection represents the degree of variability within that data set.
In other words, a Z-score is a numerical measurement that describes the relationship of a value to the mean of a set of values. A Z-score of 0 implies that the data point's value is the same as the mean score. A Z-score of 1.0 indicates that the result is one standard deviation from the mean.
Formula to calculate Z-score
To calculate Z-score, we use the following formula:
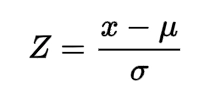
Here, x is the observed value, u is the mean of the dataset, 𝞼 is the standard deviation of the dataset.
Now we will see how to use Z-score to determine outliers.
Determining Outliers
Let us import all the libraries that we need to detect outliers.
import numpy as np
import pandas as pd
import matplotlib.pyplot as plt
import seaborn as sns
from scipy import stats
Now, we will create a dataset of 100 data points with a normal distribution. The center of the data will be around 50, with a standard deviation of 10.
center, sigma = 50, 10
arr = np.random.normal(center, sigma, 100)
arrThis will be the dataset of 100 data points.
array([61.49460661, 45.1023472 , 51.78986883, 42.51980386, 68.11223934,
      50.66495599, 37.53308896, 61.83139589, 51.59379644, 53.61459747,
      35.60259965, 63.30009665, 60.1926194 , 46.42855569, 59.22850286,
      45.61816394, 56.18288412, 45.77354684, 26.15110412, 64.42770308,
      56.25320866, 46.48827721, 48.14283234, 54.31208731, 47.08086295,
      35.17823801, 56.16248305, 39.97751632, 50.71037198, 50.63668073,
      44.98266923, 46.91999836, 49.28479198, 54.98229185, 60.25853896,
      60.21243074, 65.00378001, 39.94141726, 57.49908388, 60.83314046,
      46.60365474, 45.55099493, 40.59263702, 53.101943  , 49.65783785,
      60.10224077, 58.19242938, 62.56948725, 50.34070322, 47.47520474,
      42.54019286, 43.40945305, 57.92680051, 41.37411292, 76.17259883,
      48.21197159, 50.45396634, 53.10946282, 59.39408584, 51.61871426,
      40.32823443, 44.71916767, 47.09178552, 41.03276517, 29.79251749,
      52.63266057, 47.35896827, 43.9674461 , 36.16581531, 35.45294911,
      40.37166821, 48.73193868, 62.67935678, 52.91315534, 28.76964081,
      54.31515084, 41.6760045 , 67.07296591, 39.61670122, 55.48969005,
      74.95540754, 53.12144578, 38.53875759, 55.52183603, 33.89083137,
      60.94536205, 54.59724075, 52.08399806, 61.83084635, 52.52125535,
      45.83371151, 50.2872553 , 50.95526656, 55.29526553, 37.20238468,
67.29538505, 35.93577463, 49.83686733, 47.30895851, 46.00202758])Let us plot our data to see the distribution of the dataset we created. To plot the dataset, we will use the matplotlib library.
plt.hist.(arr)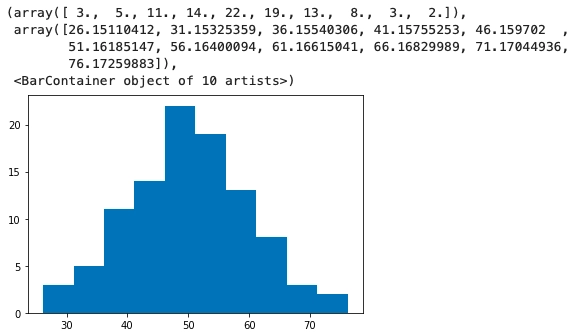
As we can interpret from the above plot, the dataset has zero outliers with a standard deviation of 10. To use Z-score to detect outliers, we need to create one. We will change three data points in the way shown below:
arr[20] = 101
arr[80] = -10
arr[50] = -1Now, we will plot the histogram and check that there are some outliers in our dataset.
plt.hist(arr)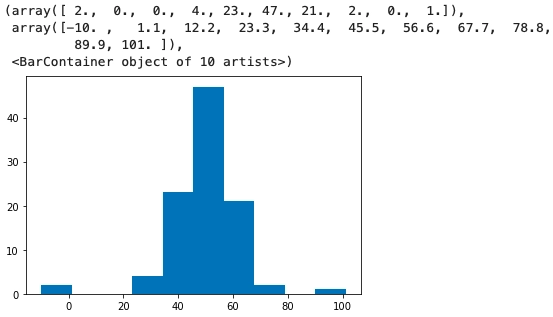
As you can see in the plot above, there are some outliers in our dataset. Now we will use the Z-score method to detect those outliers present in our dataset. Before going onto the method of detecting outliers, we will first create a dataframe of the dataset that we have created using the following code.
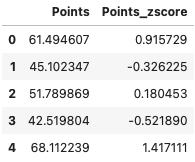
data = pd.DataFrame(arr, columns=["Points"])
data.head()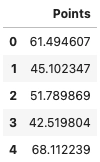
Now let us calculate the Z-score using the following function.
for col in data.columns:
    col_zscore = col + "_zscore"
    data[col_zscore] = (data[col] - data[col].mean())/data[col].std(ddof=0)
data.head()In the following code, we are creating an extra column to store the Z-score of every point in the dataset. To find the Z-score of every data point in the dataset, we have divided the difference of data points and mean of the data set with the standard deviation of the dataset. The image below displays the dataframe of the dataset that we created.
Z-Score is simply how many standard deviations away my real number is from the mean value based on the business context; you may specify the threshold value for the z score to designate a point as an outlier or not in the present scheme of things. As seen below, we pass 3 for the threshold value:
data["Outlier"] = (abs(data["Points_zscore"])>3).astype(int)In the above code snippet, we are taking abs() (absolute value) of all the outliers.
Now let us have a look at our dataframe. An extra column named Outlier has been added to our dataframe.
data.head()
Selecting all the rows that have Outlier value as 1.
data[data["Outlier"] == 1]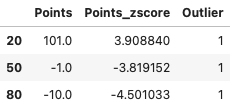
To get the total number of outliers we can use the following command:
print("Number of Outliers = " + str(data.Outlier.value_counts()[1]))Number of Outliers = 3Now remove the outliers from the dataset using the following function
data = data[data["Outlier"] == 0]
print(data.shape)
data.head()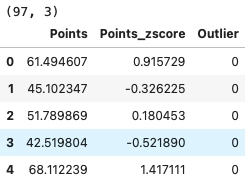
As we can see that all the three data points that we have edited have been removed from the dataframe as they were marked as an outlier. We can also confirm by plotting the histogram whether the outlier has been removed or not.
plt.hist(data["Points"])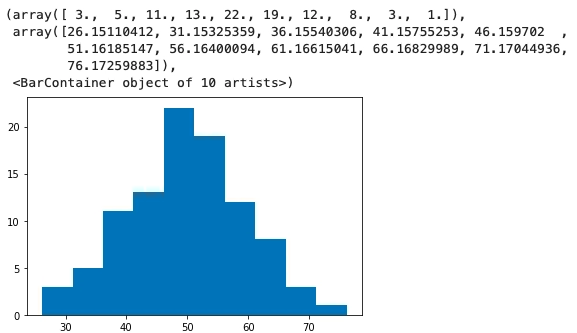


 9+ registered

