Last Updated: 29 Dec, 2020

Largest rectangle in a histogram

Hard
Asked in companies
DelhiveryCultfitGoldman Sachs

Problem statement

You have been given an array/list 'HEIGHTS' of length ‘N. 'HEIGHTS' represents the histogram and each element of 'HEIGHTS' represents the height of the histogram bar. Consider that the width of each histogram is 1.

You are supposed to return the area of the largest rectangle possible in the given histogram.

For example :
In the below histogram where array/list elements are {2, 1, 5, 6, 2, 3}.

alt text

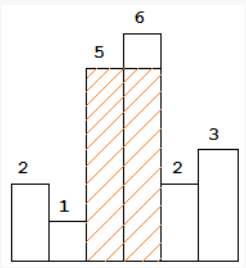
The area of largest rectangle possible in the given histogram is 10.
Input format :
The first line contains a single integer ‘T’ denoting the number of test cases.

The first line of each test case contains a single integer ‘N’ denoting the number of elements in the array/list.

The second line contains ‘N’ single space-separated integers denoting the elements of the array/list.
Output format :
For each test case, print an integer denoting the area of the largest rectangle possible in the given histogram.
Note :
You do not need to print anything; it has already been taken care of. Just implement the given function.
Constraints :
1 <= T <= 10
1 <= N <= 10^6
0 <= HEIGHTS[i] <= 10^9

Where ‘T’ is the number of test cases.
'N' is the length of the given array/list.
And, HEIGHTS[i] denotes the height of the 'ith' histogram bar.

Time Limit: 1 sec.

Approaches

01 Approach

Our intuition is to consider each and every rectangle once so that we can calculate which rectangle has the maximum area.


A simple solution to this problem is to one by one consider all bars as starting points and calculate the area of all rectangles starting with every bar and iterating towards the end of the array/list. Finally, return the maximum of all possible areas.

02 Approach

The idea is to find the minimum value in the given array/list which comes out to be the lowest histogram bar. Now once we have an index of the minimum value, the max area is the maximum of the following three values.


  1. The maximum area on the left side of the minimum value. Here we are trying to find the area of the rectangle towards the left side of the minimum value bar excluding the min value.
  2. The maximum area on the right side of the minimum value. Here we are trying to find the area of the rectangle towards the right side of the minimum value bar excluding the min value.
  3. The number of bars multiplied by the minimum value.


We use a loop with two pointers named “LPTR” and “RPTR” and at each iteration, we advance the one that has a higher neighbour until I reach the end in both directions.

03 Approach

In this approach, we will create a segment tree. In each node of the segment tree, we will maintain a range of elements and the index of the minimum element in the range. We will create a class SegTreeNode which contains the following members-:

  1. The variables start and end store the starting and end of the current range.
  2. The minimum variable min store the minimum index of the element in the range.
  3. The variables left and right store the pointer to the nodes to the left and right subtree of the current node.


After creating the tree, we will use the segment tree to find the maximum area of the histogram. We will find the index of the minimum element in the range from start to end and let take the variable name as minIndex. At each step, we have three possibilities-:

  1. We will find the area from the range of start to minIndex - 1.
  2. We will find the area from the range of minIndex + 1 to end.
  3. Since the minimum element in the range from start to end is heights[minIndex]. We can choose the histogram with heights[minIndex]. The area of the histogram would be  heights[minIndex] * (end - start + 1)
  4. In the end, we will return the maximum area that we have obtained.


Algorithm:

  • Create a function query(root, heights, start, end)
    • We will check if the current range of start to end is out of range of the current segment tree node root.
      • We will return -1
    • We will check if the current range of start to end is in the range of the current segment tree node root.
      • We will return the min of root
    • Set leftMin as the minimum index from the left subtree of the root,i.e, query(left node of root, heights, start, end)
    • Set rightMin as the minimum index from the right subtree of the root,i.e, query(right node of root, heights, start, end)
    • Return the index of minimum height element by comparing heights[leftMin] and heights[rightMin].
       
  • Create a function calculateMax(heights, root, start, end)
    • Check if the current range only contains only one element
      • Return height[start]
    • Set minIndex as the minimum element index in the range from start to end
    • We will now find the maximum area of histogram from start to minIndex - 1. We will set leftMax as calculateMax(heights, root, start, minIndex - 1)
    • We will now find the maximum area of histogram from minIndex + 1 to end. We will set leftMax as calculateMax(heights, root, minIndex + 1, end)
    • The minimum element in the range from start to end is heights[minIndex]. We will find the area of the histogram with height heights[minIndex]. We will set minMax as heights[minIndex] * (end - start + 1).
    • In the end, we will return the maximum of leftMax, rightMax, and minMax.
       
  • Create a function buildSegmentTree(heights, start, end)
    • Create a segment tree node root for the current range
    • Check if the current range only contains only one element
      • Set min of root as start
      • Return root
    • Set middle as the average of start and end
    • Set left subtree of root as buildSegmentTree(heights, start, middle)
    • Set right subtree of root as buildSegmentTree(heights, middle + 1, end)
    • Set min of the root as the index of the minimum element from both parts.
       
  • Set root as buildSegmentTree(heights, 0, size of heights - 1)
  • Set answer as calculateMax(heights, root, 0, size of heights - 1)
  • Return the variable answer

04 Approach

For every bar ‘X’, we calculate the area with ‘X’ as the smallest bar in the rectangle. If we calculate such an area for every bar ‘X’ and find the maximum of all areas, our task is done. How to calculate the area with ‘X’ as the smallest bar? We need to know the index of the first smaller (smaller than ‘X’) bar on the left of ‘X’ and the index of the first smaller bar on the right of ‘X’. Let us call these indexes ‘LEFT_INDEX' and ‘RIGHT_INDEX’ respectively.


We traverse all histograms from left to right, maintaining a stack of histograms. Every histogram is pushed to stack once. A histogram is popped from the stack when a histogram of smaller height is seen. When a histogram is popped, we calculate the area with the popped histogram as the smallest histogram. How do we get the left and right indexes of the popped histogram – the current index tells us the ‘RIGHT_INDEX’ and the index of the previous item in the stack is the ‘LEFT_INDEX'.


  1. Create an empty stack.
  2. Start from the first histogram bar, and do the following for every bar ‘heights[i]’ where ‘I’ varies from 0 to ‘N’-1.
  • If the stack is empty or heights[i] is higher than the bar at top of the stack, then push ‘I’ to the stack.
  • If this bar is smaller than the top of the stack, then keep removing the top of the stack while the top of the stack is greater. Let the removed bar be heights[tp]. Calculate the area of the rectangle with heights[tp] as the smallest bar. For heights[tp], the ‘left index’ is the previous (previous to tp) item in the stack and the ‘RIGHT_INDEX'  is ‘I’ (current index).
  • If the stack is not empty, then one by one remove all bars from the stack and do step 4 for every removed bar.