


Problem
Bar chart
Easy

0/10
Problem statement
The bar graph given below shows the sales of books (in thousand number) from six branches of a publishing company during two consecutive years 2000 and 2001.
Sales of Books (in thousand numbers) from Six Branches - B1, B2, B3, B4, B5 and B6 of a publishing Company in 2000 and 2001.
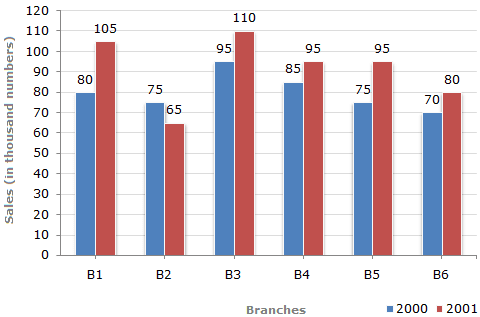
What is the ratio of the total sales of branch B2 for both years to the total sales of branch B4 for both years?
Bar chart
Pick one correct answer from below
Pick one correct answer from below