
The job search landscape has undergone a significant transformation in recent years. Gone are the days of simply sending out paper resumes and waiting for a response. Today, Applicant Tracking…
Latest 50+ Data Analyst Interview Questions and Answers
17 min read
10,770 views
1 likes
With industries such as IT, banking, healthcare, and e-commerce relying on data to drive decisions, the demand for data analysts in India is growing rapidly. According to NASSCOM reports, data analytics jobs are projected to grow at a rate of over 20% annually, creating opportunities for college students and fresh graduates.
This comprehensive guide covers everything you need to know about data analyst interviews, from understanding the role to mastering technical questions.
Who is a Data Analyst?
A data analyst is a professional who collects, processes, and analyzes data to help organizations make informed business decisions. In today’s data-driven world, data analysts serve as the bridge between raw data and actionable insights, transforming complex datasets into meaningful stories that drive strategic decisions.
Data analysts work across various industries in India, from IT services and e-commerce to banking and healthcare. They use statistical techniques, programming languages like SQL and Python, and visualization tools like Tableau to uncover patterns, trends, and correlations in data. The role requires a unique combination of technical skills, analytical thinking, and business knowledge.
For freshers entering the Indian job market, data analyst positions offer excellent career prospects with competitive salaries ranging from ₹3-8 lakhs per annum for entry-level positions, depending on the company and location. Major Indian cities like Bangalore, Pune, Hyderabad, and Mumbai have emerged as data analytics hubs, offering numerous opportunities for aspiring analysts.
Data Analyst Roles and Responsibilities
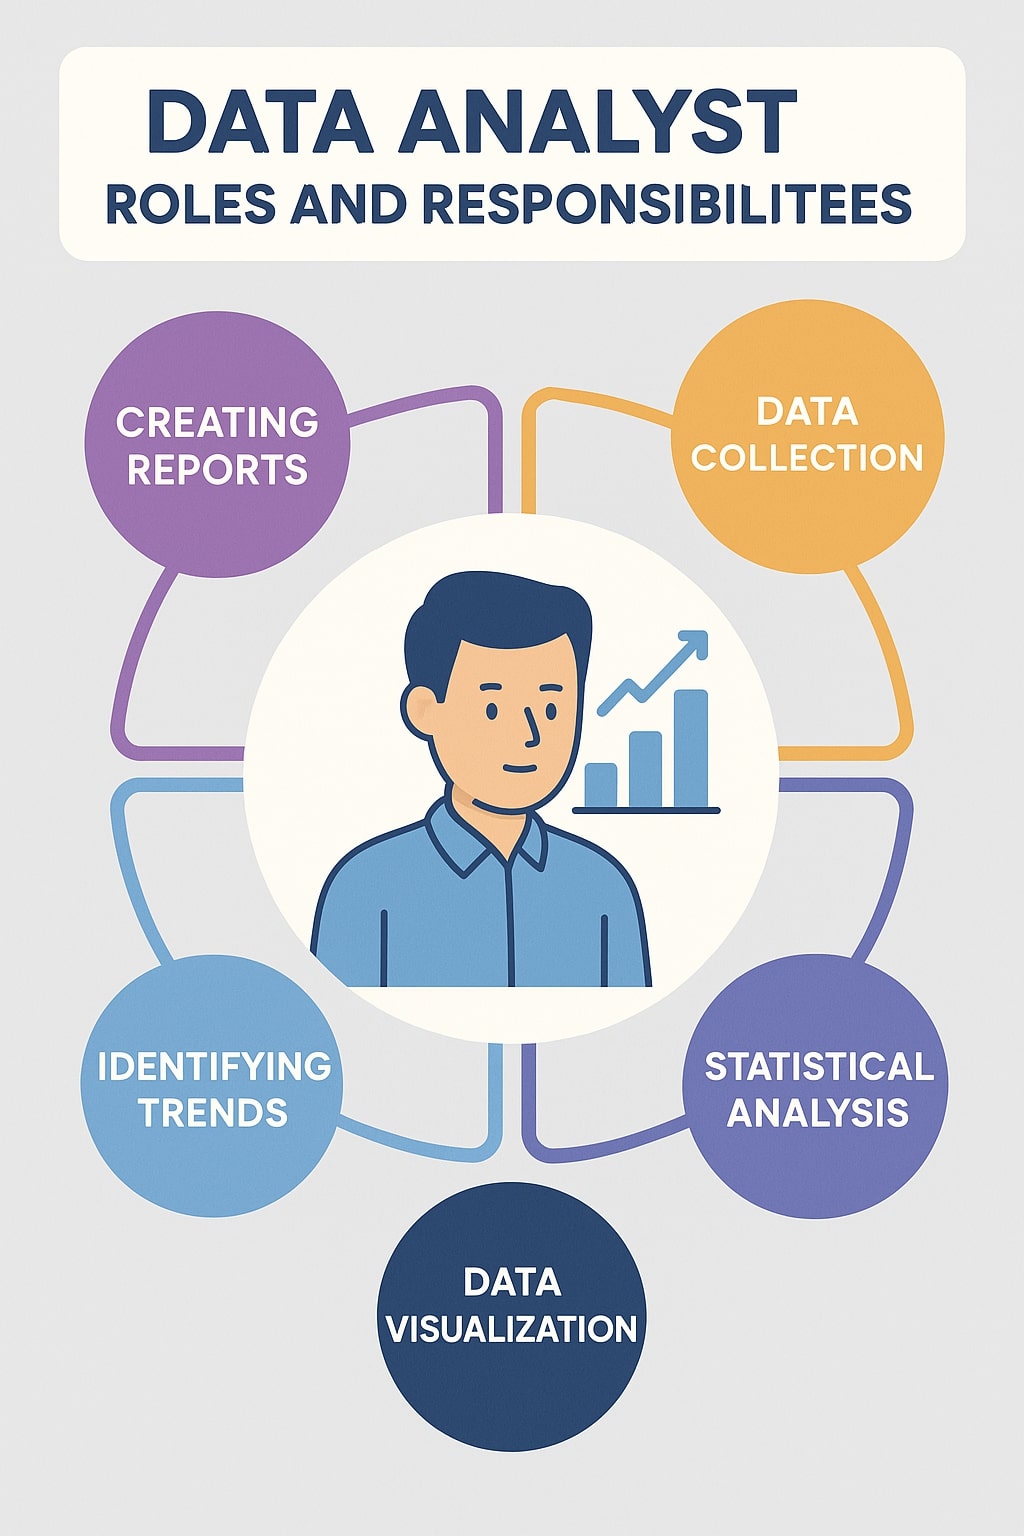
A data analyst’s roles and responsibilities include collecting, cleaning, analyzing, and visualizing data to support informed decisions.
Their primary responsibilities include:
- Data Collection: Pulling information from databases, APIs, and spreadsheets.
- Data Cleaning: Removing duplicates, handling missing values, and ensuring data accuracy.
- Data Analysis: Identifying trends, anomalies, and patterns.
- Visualization: Creating charts and dashboards using tools like Tableau or Power BI.
- Reporting: Presenting actionable insights to stakeholders simply and clearly.
- Collaboration: Working closely with business, marketing, and engineering teams to align insights with organizational goals.
Data Analyst Interview Questions for Freshers
Preparing for data analyst interviews requires understanding both fundamental concepts and practical applications. Here are essential questions that freshers commonly encounter:
What is the difference between data analysis and data analytics?
Data analysis refers to the process of examining, cleaning, and modeling data to discover useful information. Data analytics is a broader field that encompasses the entire process of collecting, processing, analyzing, and interpreting data to support decision-making. Analytics often involves predictive and prescriptive methods, while analysis can be more descriptive in nature.
Explain the data analysis process.
The data analysis process typically follows these steps: Problem Definition → Data Collection → Data Cleaning → Exploratory Data Analysis → Statistical Analysis → Interpretation → Communication of Results. Each step is crucial for ensuring accurate and meaningful insights.
What are the different types of data?
Data can be categorized as: Quantitative (numerical) vs Qualitative (categorical), Discrete vs Continuous, Structured vs Unstructured, and Primary vs Secondary data. Understanding these classifications helps in choosing appropriate analytical methods.
What is data cleaning, and why is it important?
Data cleaning involves identifying and correcting errors, inconsistencies, and missing values in datasets. It’s crucial because poor data quality leads to incorrect analysis and flawed business decisions. Clean data ensures reliable insights and accurate predictions.
Explain the difference between population and sample.
A population includes all members of a defined group, while a sample is a subset of the population. Sampling allows us to make inferences about the entire population without analyzing every member, making analysis more efficient and cost-effective.
What is correlation, and how is it different from causation?
Correlation measures the strength and direction of a relationship between two variables. Causation implies that one variable directly causes changes in another. The key principle: correlation does not imply causation. Two variables can be correlated due to a third variable or a mere coincidence.
Explain different types of sampling methods.
Common sampling methods include: Simple Random Sampling, Systematic Sampling, Stratified Sampling, and Cluster Sampling. Each method has specific use cases depending on the population characteristics and research objectives.
What is a pivot table, and when would you use it?
A pivot table is a data summarization tool that allows you to reorganize and summarize selected columns and rows of data. It’s useful for creating quick summaries, identifying patterns, and performing cross-tabulation analysis without writing complex formulas.
What are measures of central tendency?
The three main measures are: Mean (average value), Median (middle value when data is sorted), and Mode (most frequently occurring value). Each measure provides different insights and is suitable for different types of data distributions.
What is standard deviation, and why is it important?
Standard deviation measures the spread or dispersion of data points from the mean. It’s important because it helps understand data variability, identify outliers, and assess the reliability of the mean as a representative measure.
How would you handle missing data in a dataset?
Missing data can be handled through: Deletion (listwise or pairwise), Imputation (mean, median, mode, or predictive methods), or using algorithms that handle missing values. The choice depends on the amount of missing data, its pattern, and the analysis requirements.
What key performance indicators (KPIs) would you track for an e-commerce website?
Important e-commerce KPIs include: Conversion Rate, Average Order Value, Customer Acquisition Cost, Customer Lifetime Value, Bounce Rate, Cart Abandonment Rate, and Return on Advertising Spend (ROAS).
How would you identify outliers in data?
Outliers can be identified using: Statistical methods (Z-score, IQR method), Visualization techniques (box plots, scatter plots), and Domain knowledge. The 1.5 × IQR rule is commonly used: values below Q1 – 1.5 × IQR or above Q3 + 1.5 × IQR are considered outliers.
Explain A/B testing.
A/B testing is a controlled experiment where two versions (A and B) are compared to determine which performs better. It involves randomly dividing users into groups, exposing them to different versions, and measuring the impact on key metrics to make data-driven decisions.
What is data validation, and why is it necessary?
Data validation ensures data accuracy, completeness, and consistency. It involves checking data against predefined rules, formats, and constraints. It’s necessary to maintain data quality, prevent errors from propagating through analysis, and ensure reliable insights.
How would you approach analyzing customer churn?
Customer churn analysis involves: Defining churn clearly, Identifying relevant features (usage patterns, demographics, and engagement metrics). Performing exploratory analysis to understand churn patterns, building predictive models, and developing retention strategies based on insights.
What steps would you take to analyze seasonal trends in sales data?
To analyze seasonal trends: Plot time series data to visualize patterns, apply seasonal decomposition techniques, calculate year-over-year comparisons, use moving averages to smooth short-term fluctuations, and consider external factors that might influence seasonality.
How would you measure the success of a marketing campaign?
Campaign success can be measured through Return on Investment (ROI), Cost per Acquisition (CPA), Conversion rates, Brand awareness metrics, Engagement rates, and Long-term customer value. The specific metrics depend on campaign objectives.
What would you do if your analysis results contradict stakeholder expectations?
When results contradict expectations: Double-check the analysis for errors, validate data sources and methodology, and Present findings clearly with supporting evidence. Discuss potential reasons for unexpected results, and collaborate with stakeholders to understand their assumptions.
How would you present complex analytical findings to non-technical stakeholders?
Effective presentation involves: Using clear, jargon-free language; creating intuitive visualizations; focusing on business implications rather than technical details; Providing actionable recommendations; and using storytelling techniques to make data compelling.
General Data Analyst Interview Questions with Answers
General data analyst interview questions assess your overall understanding of the field and your ability to think analytically about business problems.
Why do you want to become a data analyst?
Focus on your passion for solving problems through data, interest in uncovering insights that drive business decisions, and desire to work at the intersection of technology and business. Mention specific aspects of data analysis that excite you, such as pattern recognition or predictive modeling.
What makes a good data analyst?
A good data analyst combines technical skills (statistical knowledge, programming, and visualization tools) with soft skills (communication, critical thinking, and curiosity). They should be detail-oriented, possess business acumen, and have the ability to translate complex findings into actionable insights.
How do you stay updated with the latest trends in data analytics?
Mention resources like industry blogs (Towards Data Science, KDnuggets), online courses (Coursera, edX), professional communities (Kaggle, LinkedIn groups), conferences, and newsletters. Emphasize continuous learning and practical application of new techniques.
Describe a challenging analytical project you worked on.
Prepare a specific example from your academic projects, internships, or personal work. Structure your answer using the STAR method (Situation, Task, Action, Result), highlighting the analytical techniques used and business impact achieved.
How would you explain technical concepts to business stakeholders?
Emphasize using analogies, avoiding jargon, focusing on business implications, using visuals, and checking for understanding. Demonstrate your ability to bridge the gap between technical analysis and business strategy.
What is your approach to learning new analytical tools?
Describe a systematic approach: understanding the tool’s purpose and strengths, starting with basic tutorials, practicing with real datasets, joining user communities, and gradually tackling more complex applications. Mention specific examples of tools you’ve learned.
How do you ensure data accuracy in your analysis?
Discuss data validation techniques, cross-verification with multiple sources, understanding data collection processes, performing sanity checks, and documenting assumptions. Emphasize the importance of questioning unexpected results.
What role does domain knowledge play in data analysis?
Domain knowledge helps in understanding context, identifying relevant variables, interpreting results correctly, recognizing data quality issues, and asking the right questions. It’s the difference between mechanical analysis and meaningful insights.
How do you prioritize multiple analytical requests?
Discuss factors like business impact, urgency, resource requirements, and stakeholder expectations. Mention communication with stakeholders about timelines and the importance of setting clear expectations.
What are the biggest challenges facing data analysts today?
Common challenges include data quality issues, keeping up with rapidly evolving tools, translating analysis into business action, handling increasing data volumes, and ensuring data privacy and security. Show awareness of industry trends and challenges.
Data Analyst Interview Questions On Statistics
Statistical knowledge forms the backbone of data analysis. These questions assess your understanding of statistical concepts and their practical applications.
What is the difference between Type I and Type II errors?
Type I error (false positive) occurs when we reject a true null hypothesis. Type II error (false negative) happens when we accept a false null hypothesis. The significance level (α) controls Type I error probability, while power (1-β) relates to Type II error probability.
Explain the Central Limit Theorem and its importance.
The Central Limit Theorem states that the sampling distribution of the mean approaches a normal distribution as sample size increases, regardless of the population distribution. It’s crucial because it allows us to make inferences about population parameters using normal distribution properties, even with non-normal populations.
What is the difference between parametric and non-parametric tests?
Parametric tests assume specific distributions (usually normal) and use population parameters. Non-parametric tests make no distributional assumptions and use ranks or medians. Examples: t-test vs. Mann-Whitney U, ANOVA vs. Kruskal-Wallis.
When would you use a chi-square test?
Chi-square tests are used for categorical data to test independence between variables or goodness of fit to expected distributions. Common applications include testing whether two categorical variables are related or if observed frequencies match expected frequencies.
Explain p-value and statistical significance.
P-value is the probability of observing results as extreme or more extreme than those observed, assuming the null hypothesis is true. Statistical significance (typically p < 0.05) suggests that observed results are unlikely due to chance alone, providing evidence against the null hypothesis.
What is a confidence interval, and how do you interpret it?
A confidence interval is a range of values that likely contains the true population parameter with a specified level of confidence (e.g., 95%). It provides information about the precision of our estimate and the uncertainty around it.
Describe different types of regression analysis.
Linear regression models the relationship between variables using a straight line. Multiple regression includes multiple independent variables. Logistic regression is used for binary outcomes. Polynomial regression captures nonlinear relationships. Ridge and Lasso regression help with multicollinearity and feature selection.
What is multicollinearity, and how do you detect it?
Multicollinearity occurs when independent variables are highly correlated, making it difficult to isolate individual variable effects. Detection methods include correlation matrices, Variance Inflation Factor (VIF), and condition indices. Solutions include removing variables or using regularization techniques.
Explain the assumptions of linear regression.
Linear regression assumes linearity (the relationship between variables is linear), independence (observations are independent), homoscedasticity (constant variance of residuals), normality (residuals are normally distributed), and no multicollinearity among predictors.
What is ANOVA and when would you use it?
ANOVA (Analysis of Variance) tests whether means of multiple groups are significantly different. One-way ANOVA compares means across one factor, while two-way ANOVA examines two factors and their interaction. It’s used when comparing more than two groups simultaneously.
Excel Data Analyst Interview Questions with Answers
Excel remains a fundamental tool for data analysts, especially in the Indian business context, where many organizations rely heavily on spreadsheet-based analysis.
What are the most important Excel functions for data analysis?
Key functions include VLOOKUP/XLOOKUP for data retrieval, SUMIFS/COUNTIFS for conditional aggregation, INDEX/MATCH for flexible lookups, PIVOT functions for summarization, statistical functions (AVERAGE, MEDIAN, STDEV), and text functions (LEFT, RIGHT, MID) for data cleaning.
How do you handle large datasets in Excel?
Techniques include using Excel tables for better performance, applying filters to work with subsets, using array formulas efficiently, minimizing volatile functions, splitting large datasets across multiple sheets, and considering Power Query for data processing.
Explain the difference between VLOOKUP and INDEX/MATCH.
VLOOKUP searches for values in the leftmost column and returns values from columns to the right. INDEX/MATCH is more flexible, allowing lookups in any direction, handling column insertions better, and generally performing faster with large datasets.
How do you create dynamic charts in Excel?
Dynamic charts can be created using named ranges with the OFFSET function, Excel tables (which automatically expand), dynamic array formulas, or combo boxes with data validation to change chart data sources dynamically.
What is Power Query, and how is it useful?
Power Query is Excel’s data transformation tool that allows importing, cleaning, and reshaping data from various sources. It’s useful for automating repetitive data preparation tasks, combining data from multiple sources, and maintaining data refresh workflows.
How do you identify and handle duplicates in Excel?
Duplicates can be identified using conditional formatting, the Remove Duplicates feature, or formulas like COUNTIF. Handling strategies include removing exact duplicates, highlighting for manual review, or using advanced criteria to determine which duplicates to keep.
Explain different types of Excel charts and their use cases.
Common chart types: Column charts for comparing categories, Line charts for trends over time, Scatter plots for correlations, Pie charts for parts of a whole, Bar charts for ranking, and Combo charts for multiple metrics with different scales.
How do you protect and validate data in Excel?
Data protection methods include password-protecting worksheets/workbooks, using data validation to restrict input types, creating dropdown lists, setting up input ranges, and using conditional formatting to highlight errors or outliers.
What are array formulas, and when would you use them?
Array formulas perform calculations on arrays of data and can return multiple results. They’re useful for complex calculations, matrix operations, and advanced lookups. In Excel 365, dynamic arrays have simplified many array formula applications.
How do you optimize Excel workbook performance?
Optimization techniques include minimizing volatile functions (NOW, TODAY), using efficient formulas, avoiding entire column references, limiting conditional formatting ranges, reducing file size through data compression, and using binary format (.xlsb) for large files.
SQL Interview Questions for Data Analysts
SQL proficiency is essential for data analysts, as most organizational data resides in relational databases. These questions cover fundamental to intermediate SQL concepts.
Explain the difference between WHERE and HAVING clauses.
WHERE filters rows before grouping occurs and cannot use aggregate functions. HAVING filters groups after GROUP BY and can use aggregate functions. Example: WHERE filters individual sales records; HAVING filters groups like total sales by region.
What are the different types of JOINs, and when do you use them?
INNER JOIN returns matching records from both tables. LEFT JOIN returns all records from the left table and matched records from the right. RIGHT JOIN does the opposite. FULL OUTER JOIN returns all records from both tables. CROSS JOIN creates a Cartesian product.
What is the difference between the RANK() and DENSE_RANK() functions?
RANK() leaves gaps in ranking when there are ties (1, 2, 2, 4), while DENSE_RANK() doesn’t leave gaps (1, 2, 2, 3). ROW_NUMBER() assigns unique sequential numbers regardless of ties.
How do you handle NULL values in SQL?
NULL handling functions include: IS NULL/IS NOT NULL for checking, COALESCE for returning the first non-null value, ISNULL/IFNULL for replacing nulls, and NULLIF for creating nulls. NULLs require special consideration in comparisons and calculations.
Explain the difference between UNION and UNION ALL.
UNION combines results from multiple SELECT statements and removes duplicates. UNION ALL combines results but keeps all duplicates. UNION ALL is faster as it doesn’t perform deduplication.
What are window functions, and provide examples.
Window functions perform calculations across a set of rows related to the current row. Examples include ROW_NUMBER(), RANK(), LAG(), LEAD(), and aggregate functions with the OVER clause. They don’t collapse rows like GROUP BY.
How do you optimize SQL query performance?
Optimization techniques: use appropriate indexes, avoid SELECT *, use WHERE clauses to limit rows, use JOINs instead of subqueries when possible, analyze execution plans, avoid functions in WHERE clauses, and use LIMIT for large result sets.
What are Common Table Expressions (CTEs) and their benefits?
CTEs are temporary named result sets defined within an SQL statement using the WITH clause. Benefits include improved readability, recursive operations, multiple references within the same query, and better organization of complex queries compared to subqueries.
Tableau Data Analyst Interview Questions with Answers
Tableau is a leading data visualization tool widely used in Indian organizations for business intelligence and analytics reporting.
What is the difference between dimensions and measures in Tableau?
Dimensions are qualitative fields that categorize data (names, dates, geographical locations). Measures are quantitative fields that can be aggregated (sales, profit, quantity). Tableau automatically classifies fields, but you can change their roles based on analysis needs.
Explain different types of filters in Tableau.
Filter types include: Extract filters (applied during data extraction), Data source filters (applied to the entire data source), Context filters (create filtering hierarchy), Dimension filters (filter categorical data), Measure filters (filter numerical data), and Table calculation filters (applied to calculated results).
What are calculated fields, and how do you create them?
Calculated fields are new fields created using existing data through formulas. They’re created using Tableau’s calculation language, which includes functions for string manipulation, date operations, logical statements, and mathematical operations. Example: Profit Ratio = [Profit]/[Sales].
How do you create a dual-axis chart in Tableau?
Dual-axis charts display two measures with different scales. Create by dragging a measure to rows, dragging a second measure to rows, right-clicking the second measure’s axis and selecting “Dual Axis,” then right-clicking the axis and selecting “Synchronize Axis” if needed.
What is the difference between joining and blending in Tableau?
Joining combines data from multiple tables at the data source level before analysis. Blending combines data from different data sources during analysis, maintaining separate queries. Use joins for tables from the same database and blending for different data sources.
Explain Tableau’s order of operations.
Tableau processes filters and calculations in this order: Extract filters → Data source filters → Context filters → Dimension filters → Measure filters → Table calculation filters. Understanding this hierarchy is crucial for creating accurate calculations and filters.
What are LOD (Level of Detail) expressions?
LOD expressions allow calculations at different granularities than the view level. Three types: FIXED (ignores view dimensions), INCLUDE (adds dimensions to view level), and EXCLUDE (removes dimensions from view level). Example: {FIXED [Region] : SUM([Sales])}.
How do you create parameters in Tableau, and what are their uses?
Parameters are dynamic input controls created through the Data pane. Uses include creating what-if scenarios, allowing users to choose measures or dimensions, setting threshold values for calculations, and enabling dynamic filtering or sorting.
What is data blending, and when would you use it?
Data blending combines data from multiple data sources by linking common dimensions. Use when working with data from different databases, needing to combine summary data with detailed data, or when joining isn’t possible due to different granularities.
How do you optimize Tableau dashboard performance?
Performance optimization techniques: limit data using filters and extracts, use context filters appropriately, minimize complex calculations, optimize chart types, reduce the number of marks displayed, use aggregated data when possible, and avoid unnecessary quick filters on large datasets.
Tips for Success in Data Analyst Interviews
Succeeding in data analyst interviews requires more than just technical knowledge. Here are strategic tips specifically for Indian freshers:
- Technical Preparation: Focus on fundamentals rather than trying to learn every advanced technique. Master Excel, SQL basics, and one visualization tool thoroughly. Create a portfolio showcasing your analytical projects using publicly available datasets.
- Communication Skills: Indian employers highly value analysts who can communicate effectively with diverse stakeholders. Practice explaining technical concepts in simple terms. Prepare examples of how you’ve presented data insights to different audiences.
- Industry Awareness: Stay informed about the Indian data analytics landscape. Understand which industries are hiring (IT, banking, e-commerce, telecommunications), familiarize yourself with major Indian companies using analytics (TCS, Infosys, Flipkart, Paytm), and know about government initiatives like Digital India and their data implications.
- Cultural Considerations: Indian work environments often value collaborative problem-solving and respect for hierarchy. Show your ability to work in teams, respect for senior colleagues’ experience, and willingness to learn from others. Demonstrate adaptability, as Indian businesses often require analysts to wear multiple hats.
- Salary Negotiations: Research current market rates for data analyst positions in your target cities. Entry-level positions in tier-1 cities typically offer ₹3-8 lakhs annually, while tier-2 cities may offer ₹2.5-5 lakhs. Consider the complete compensation package, including benefits, learning opportunities, and career growth prospects.
Landing your first data analyst role in India requires thorough preparation across technical skills, statistical knowledge, and communication abilities.
Remember that interviews are not just about demonstrating technical competency but also about showing your passion for data-driven problem-solving and your ability to translate insights into business value.
FAQs on Data Analyst Interview Questions For Freshers
What are the most common data analyst interview questions for freshers?
Freshers can expect questions on SQL basics, data cleaning, Excel formulas, statistics fundamentals, and visualization tools like Tableau or Power BI. Employers also ask scenario-based questions to test problem-solving and analytical skills for real-world data challenges.
How do I prepare for data analyst interview questions for freshers?
Start with SQL, Excel, and basic statistics. Practice data visualization, work on small projects, and review past interview experiences on forums. Use online platforms to strengthen practical problem-solving skills.
What technical skills are required to answer data analyst interview questions?
A fresher should know SQL for querying, Excel for quick analysis, Tableau or Power BI for visualization, and basic Python or R for handling datasets. Foundational knowledge of statistics and probability is also essential.
What soft skills are tested in data analyst interviews for freshers?
Interviewers assess communication skills, logical reasoning, critical thinking, and the ability to explain data insights clearly. Collaboration skills and adaptability in fast-paced, data-driven environments are also frequently evaluated during interviews.
What SQL interview questions are asked for data analyst freshers?
Expect questions like writing SELECT queries, joining tables, using aggregate functions, filtering with WHERE, and understanding GROUP BY and HAVING. Some interviews may include real-time problem-solving using sample databases.
What Excel questions are common in data analyst interviews for freshers?
Freshers are often tested on Excel formulas like VLOOKUP, HLOOKUP, INDEX-MATCH, Pivot Tables, Conditional Formatting, and data cleaning functions. Employers also test proficiency in summarizing data and creating basic dashboards.
What statistics questions should freshers prepare for a data analyst interview?
Prepare for probability basics, mean, median, mode, standard deviation, hypothesis testing, p-values, and confidence intervals. Questions may also include interpreting data distributions and applying statistical methods in business scenarios.
How do I answer scenario-based data analyst interview questions as a fresher?
Use the STAR method (Situation, Task, Action, Result). Explain your thought process clearly, highlight analytical reasoning, and discuss practical examples from projects, internships, or coursework to demonstrate your approach.
What are some common Tableau interview questions for freshers?
Freshers should prepare for questions on creating dashboards, using filters, calculated fields, parameters, and understanding data joins or blending. Basic visualization principles and storytelling techniques are frequently discussed.
How to stand out while answering data analyst interview questions as a fresher?
Highlight practical experience through data analyst internships, college projects, or Kaggle datasets. Showcase your problem-solving ability, clear communication, and eagerness to learn through your entry-level data analyst resume. Tailor answers to the company’s data-driven needs to leave a lasting impression.

Latest Posts
How Does an AI Resume Analyzer Work? Everything You Need to Know
An AI resume analyzer is a tool that uses artificial intelligence to scan your resume the same way a recruiter or an Applicant Tracking System (ATS) would, checking your formatting,…
Best Fintech Companies for Freshers to Work at in India
India is one of the fastest-growing fintech markets in the world, with over 10,000 registered fintech startups and a market valuation projected to cross $150 billion by 2025. For freshers…
How to Become a CA (Chartered Accountant)
Every year, thousands of students in India ask the same question: “Should I do CA?” Some are fresh out of Class 12, weighing their options between B.Com, MBA, and the…
How To Become A Cybersecurity Analyst In India
Every time you log into your bank account, your college portal, or your favorite app, there’s a team of professionals working silently in the background, making sure no one gets…
Popular Posts
Best CV Formats for Freshers: Simple, Professional & Job-Winning Templates
Creating an effective CV (Curriculum Vitae) is the first step towards landing your dream job or internship as a fresh graduate. Your CV is your initial introduction to potential employers…
How to Pass the TCS NQT Aptitude Test?
Every year, lakhs of engineering and graduation students apply to TCS, one of India’s largest IT employers. And almost every single one of them hits the same first wall: the…
How to Make a Fresher Resume That Recruiters Notice
If you are a college student or a fresher stepping into the professional world, creating a well-structured resume is your first step to success. A polished and ATS-friendly resume can…
What is SSC CGL Exam? – Complete Details for 2026
If you’re a college student or a fresh graduate wondering, “Should I appear for SSC CGL?” you’re in the right place. Every year, over 30 lakh students apply for this…
How to Start an AI Career in India: Skills and Future of Work
Artificial Intelligence (AI) is revolutionizing industries worldwide. From automating routine tasks to enabling self-driving cars and intelligent healthcare diagnostics, AI is reshaping the future of work. For college students and…