


Introduction
Before we learn about the MNIST dataset and dive deeper into the code, we must recap Principal Component Analysis (PCA).
Principal Component Analysis (PCA) is a dimensionality reduction technique that helps us convert a high dimensional dataset(a data set with lots of features/variables) into a low dimensional dataset. PCA helps us prevent our machine learning model from overfitting on our data and enables us to retain information from all the significant variables for our model.
PCA is also used to reduce dimensionality so that we can easily visualize the data.
PCA uses feature extraction, i.e., it combines our input variables in a specific way so we can drop the least important or least significant variables while still retaining the fundamental attributes of our old variables.
PCA takes the variance(or spread) of the data into account to reduce the dimensions. Dimensions or variables having high variance have high information. Therefore, variables having very low variance can be removed or skipped.
When the variance of both the dimensions is comparable, i.e., there is no significant difference in the variance of the dimensions we are trying to compare, PCA projects the data from the two dimensions into a single vector which is the direction of the maximum variance. Let's understand this with an example.
Let us assume that we have a two-dimensional dataset, and we want to reduce the data into just one dimension. The scatter plot obtained from plotting the data is the image below.

Source: Medium
Now two principal components are calculated. The first principal component is the one in which the data variance is maximum. The second is the component with the second-highest variance in data and perpendicular to the first principal component. The number of components calculated equals the number of dimensions to which our data would be reduced. Since we want to reduce it to just one dimension, we take a projection of our data points along the first principal component( maximum variance) and thus obtain a new single feature.
Therefore PCA can be broken down into five steps:
- Standardization of the range of continuous initial variables
- Computation of the covariance matrix to identify correlations
- Calculation of the eigenvectors and eigenvalues of the covariance matrix to identify the principal components
- Creation of a feature vector to decide which principal components to keep
-
Recasting the data along the axes of the principal components.
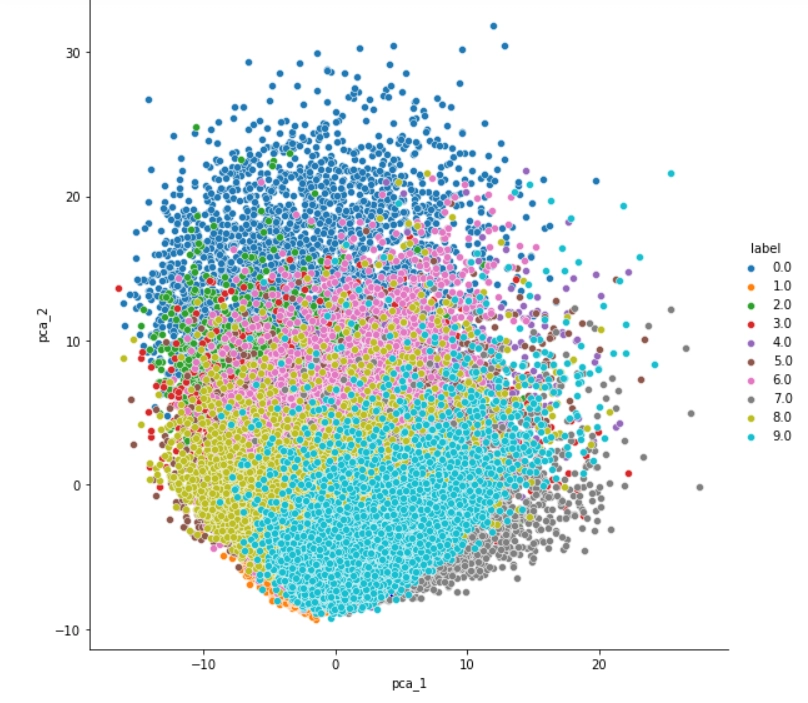
Now we will see how we can implement PCA in code as we will be applying PCA on the MNIST dataset.
MNIST Dataset
The MNIST(Modified National Institute of Standards and Technology database) is a subset of an extensive database of handwritten digit images used for training various Machine Learning models.
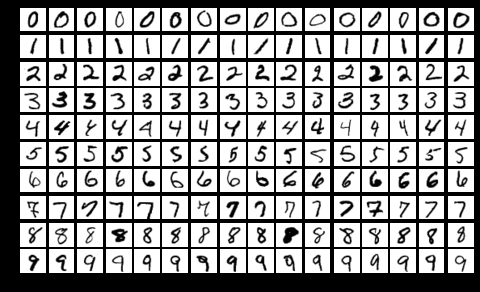
Source: Wikipedia
No. of training images: 60,000
No. of testing images: 10,000
Half of the training set and half of the test were taken from NIST's training dataset, while the other half of both respectively were taken from NSIT's testing dataset.
Each image is 28x28 pixels. Each pixel value is between 0 to 255, which denotes the lightness or darkness of that pixel.
The training data set(.csv) has 785 columns. The first column denotes the label, i.e., which digit has been drawn, and the rest of the 784 values denote the value of the pixels in the image.
You can download the dataset from https://www.kaggle.com/c/digit-recognizer/data.


 6+ registered

