Activity Log
It is used to display all the recent activities done by the virtual machine along with any configuration changes and when it was stopped & started. There are two methods to view the logs one is to view the activity log in the Azure portal, while the other is to create a diagnostic setting that would send the logs to a Log Analytics Workspace from where you can view events over time and analyze them with other collected data.

Source
VM insights
Azure Monitor has some services which have the ability to display customized monitoring experiences, such experiences are called insights. Insights include pre-built workbooks and many other specialized features for the service particularly. VM insights are designed in such a manner that they can monitor the entire set of Azure and hybrid VM in a single interface.
If a user starts to monitor multiple virtual machines in the Azure environment, then the user might want to consider enabling the following features of the VM insights:
- In order to monitor the guest operating system and the workload of the virtual machine, the user can switch on the simplified onboarding for the Log Analytics and dependency agent.
- To analyze the core performance metrics of the guest's virtual machine operating system, the user might want to consider switching on the pre-defined trending performance charts and workbooks.
-
The dependency map is used to display all those processes that are running on each virtual machine and their interconnected components with other machines.

Source
Collect guest metrics and logs
When a virtual machine is created, the Azure Monitor starts collecting metric data automatically for that VM host. An agent is required to be installed in order to collect metrics from the guest operating system of the virtual machine. If the VM insights are enabled, the Log Analytics agent gets installed and will start sending performance data to the Azure Monitor Logs, enabling Performance and Map views.
Once you have enabled VM insights, install the Azure Monitor agent, which would allow the user to collect guest logs from the virtual machine and send the guest metrics to the Azure Monitor Metrics pane. This also allows the user to analyze the metrics on the metrics pane.
Analyze Metrics
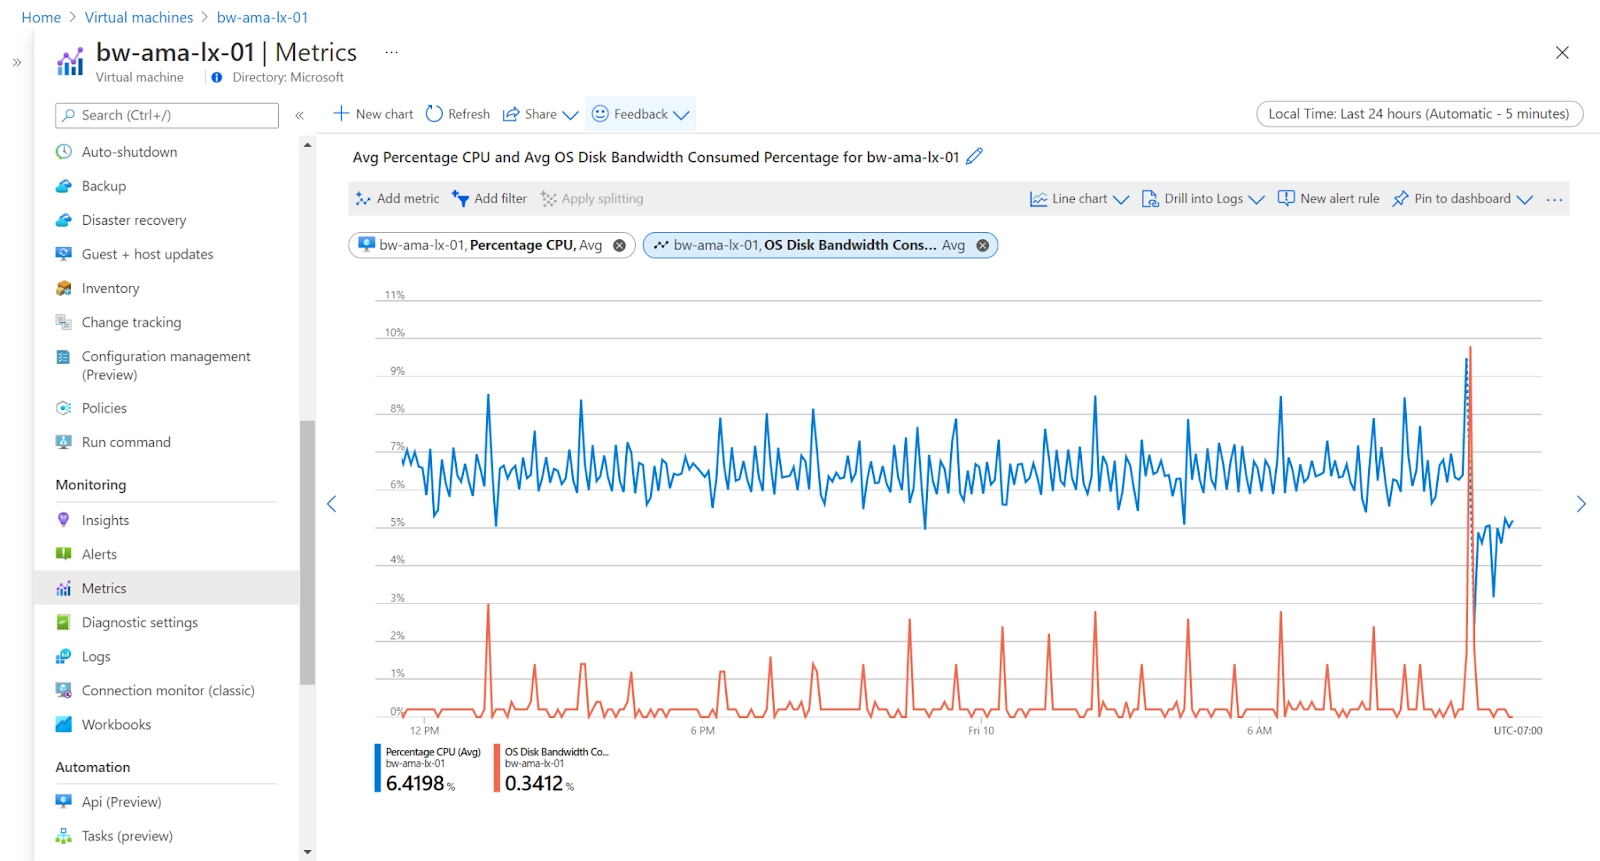
Metrics are numerical values representing the system's state at a particular point in time. The user must install the Azure Monitor agent in order to collect guest metrics even tho platform metrics for the virtual machine host are collected automatically. The overview pane contains the most common host metrics, and the others can be accessed by using the Metrics pane. This also enables the user to create charts from metric values and visually correlate trends. A user can create a metric alert rule or pin a chart to an Azure dashboard.
Source
Analyze Logs
In Azure Monitor Logs, data is stored in the Log Analytics workspace, where it is stored in separate tables, each having its own set of unique properties. The VM insights store the data in logs and provide performance and map views that the user can use to interactively analyze the data. The user can work directly with data to drill down further or perform custom analyses.
The log queries in the Log Analytics can be used to analyze all the other log data that the user collects from the virtual machine. There are several built-in queries that are available for use, or the user can create their own for the virtual machine. The user can also interact with the results of the queries by including them in a workbook to make them available to other users, or it can be used to generate alerts based on the results.

Source
Health Monitoring
Azure service health
- It provides the user with personalized information if any problem occurs in Azure services, impacting the user's services.
- It helps the user in preparing for the upcoming planned maintenance.
Azure resource health
- It helps the user to diagnose and get support when an Azure issue impacts any of the user's resources.
- The user can view the current as well as the past health of the Azure resources.
- The user can also get technical support when the user needs help with Azure service issues.
Alerts
Azure Monitor has the ability to notify the user when any important conditions are found in the monitoring data. Such types of alerts can help the user to identify and address issues in the user's system before the customer notices them.
Activity Log

Source
Resource Metrics

Source
Diagnostic Logs

Source
Any diagnostic log can be alerted using an OMS alert. For resource metrics and activity logs, the Azure monitor is used.
Suppose someone stops the virtual machine that was to be alerted, or if the CPU utilization goes beyond 90 percent in any of the virtual machines, then we want to get alerted. In Azure monitor, we can define such rules. Once the condition within the rule gets satisfied, the user can take action based on the result.
Advanced Monitoring
Operations Management Suite
Operations Management Suite, also known as OMS, contains various capabilities such as monitoring, alerting, and alert remediation across cloud and on-premises assets.
Log Analytics
It is used to collect data that is generated by resources in the user's cloud and on-premises environments and from other monitoring tools that provide analysis across multiple resources.
Network Watcher
It monitors the user's VM and associated resources as they relate to the network they are in.
Frequently Asked Questions
What is Azure Monitor?
Azure Monitor is a monitoring service that contains a complete set of features to monitor users' Azure resources.
What does the Activity log display?
The activity log is used to display recent activities by the virtual machine.
In which form is data stored in the Log Analytics workspace?
Data is stored in the form of tables in the Log Analytics workspace.
Conclusion
In this article, we have extensively discussed Azure VM Monitoring and the features it offers.
After reading about the Azure VM Monitoring, are you not feeling excited to read/explore more articles on Cloud technologies? Don't worry; Coding Ninjas has you covered. To understand the difference between AWS, Azure & Google cloud and which platform to choose: AWS vs. Azure vs. Google Cloud.
If you wish to enhance your skills in Data Structures and Algorithms, Competitive Programming, JavaScript, and many more, then you should check out our Guided path column at Coding Ninjas Studio. We at Coding Ninjas Studio organize many contests in which you can participate. You can also prepare for the contests and test your coding skills by giving the mock test series available. In case you have just started the learning process, and your dream is to crack major tech giants like Amazon, Microsoft, etc., then you should check out the most frequently asked problems and the interview experiences of your seniors that will surely help you in landing a job in your dream company.
Do upvote if you find the blogs helpful.
Happy Learning!


 8+ registered

