


Introduction
The Logs Explorer specifies a subset of all log entries in your project using Boolean expressions. These queries can be used to select log items from specific logs or log services or to meet constraints on metadata or user-defined fields.
These queries can help you identify logs quickly during time-critical troubleshooting sessions and examine your logs to learn more about the logging data available.
So, without any further ado, let us learn to create these queries with various other features about them.
Build queries in the Logs Explorer
Before you begin
To view the logs sent from an Amazon Web Services (AWS) account to Logging, use the Logs Explorer after selecting the AWS connector project in the Google Cloud console resource picker. The AWS connector project saves your Amazon Resource Name (ARN) and connects your AWS account to Google Cloud services.
To develop queries using Logs Explorer, ensure you have the appropriate Identity and Access Management permissions or roles.
Get started
To begin building queries with the console, go to Logs Explorer.
Choose the Cloud project or other Google Cloud resource for which you want to see logs.
Build queries
The Query pane is the primary tool for creating queries in Logs Explorer:
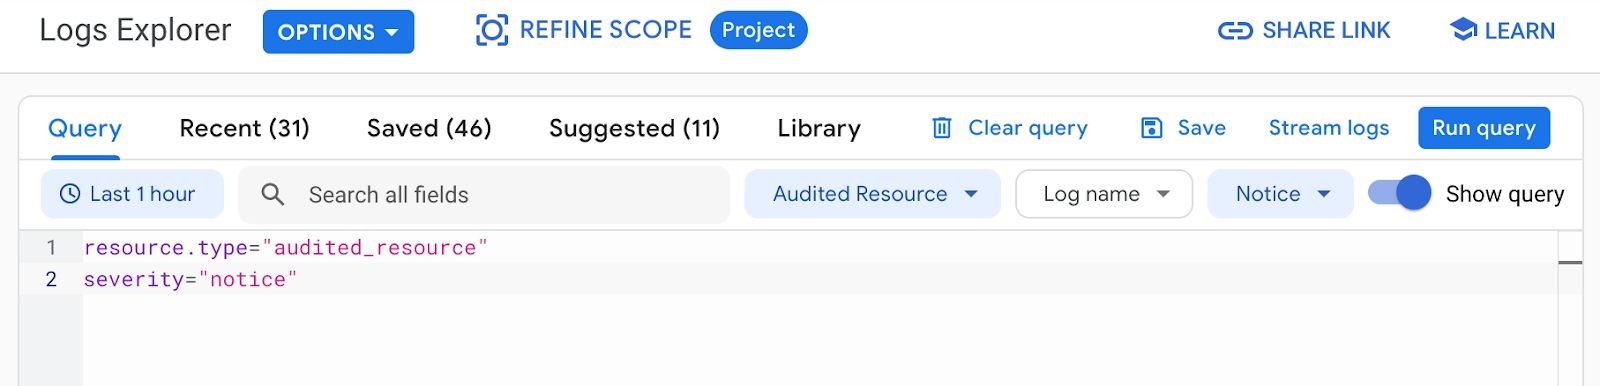
Source: Google Cloud
The Query pane offers several methods for creating and running query expressions:
- Search for text across all log fields.
- Select options from filter menus.
- Write advanced queries using the Logging query language.
- View, edit, or run the queries in the Recent, Saved, Suggested, and Library tabs.
The sections that follow go into further depth about these characteristics.
Search for text across log fields
Enter the following search phrases in the search field to search for text across all log fields and locate all matched log entries:

Source: Google Cloud
To discover log entries that contain a phrase, enclose your search phrases in quotation marks; you may also use Boolean operators in your search expressions. Enabling the Show query lets you view your search phrases within the query expression.
After you've entered your search words, click Run query or press the Enter key. The query's results are presented in the Query results window.
Boolean operators
Your search-field entries are translated into Boolean expressions that define a subset of all log entries in the Google Cloud resource you've chosen.
The search box accepts the Boolean operators AND, OR, and NOT. Keep the following in mind while using Boolean operators in your search expressions:
- Parentheses cannot be used to nest rules. Parentheses in the search phrase are interpreted as search words.
- Boolean operators must be capitalized. Lowercase and, or, and not are interpreted as search terms rather than operators.
If no operators are specified, AND is used to unite all search words and phrases. Between search keywords, you can omit the AND operator.
AND and OR are both short-circuit operators. AND and OR rules can be combined in the exact phrase.
As an example, when the two operators are combined, the statement a AND b OR c AND d becomes the Logging query language expression:
"a"
"b" OR "c"
"d"
The NOT operator takes priority over the OR and AND operators in that order.
The NOT operator is used to negate the following term. For instance, the NOT error command provides log entries without error. You may also use the - (minus) operator instead of the NOT operator. For instance, the following two queries are identical:
response AND successful AND NOT errorresponse successful -error
If the - (minus) operator is outside the quote marks, this logic also applies to a phrase. For instance, the following two queries are identical:
-"response successful"NOT "response successful"Use filter menus
You may add a resource, log name, and log severity parameters to the query-editor field using the filter menus in the Query pane. These settings relate to the LogEntry fields in Logging for all logs.

Source: Google Cloud
-
Resource: Allows you to provide the resource.type and resource.labels. Using this filter option, you may apply a single resource type and zero or more resource labels to your query. The logical operator AND connects the resource parameters.
-
Log name: This option allows you to set the logName. You can apply several log names to your query. The logical operator OR is used to select several log names.
- Severity: This allows you to choose the level of severity. You can pick different severity levels to apply to your query simultaneously. The logical operator OR is used to choose several severity levels.
To use any of the filter menus, perform the following actions:
-
Expand any of the filter options in the Query pane using the
 button.
-
Adjust the filter parameters.
-
Click the Apply button. The parameters are shown in the query-editor field.
-
Enable Show query to view your search terms within the query expression.
- After you've finished reviewing the query, click Run query. The query results are presented in the Query results window.
You see the resource name with the resource ID as subtext for specific Compute Engine resource types, such as gce_instance and gce_network. For example, the VM name appears with the VM ID in the gce_instance resource type. The resource names assist you in identifying the relevant resource ID from which to create queries.
Write queries with time restrictions
There are two methods for querying logs depending on time:
- Use the time-range selector to query.
- In the query-editor area, provide a timestamp expression.
Use the default numbers or input a new time range using the time-range option to swiftly query across seconds, minutes, hours, or days.
Use the Logging query language to add a timestamp phrase straight to the query-editor field.
If the query-editor field contains a timestamp expression, the time-range selection is disabled, and the query's time-range limitation is the timestamp expression. If a query does not employ a timestamp expression, the time-range selector is used as a time-range constraint.
Use the time-range selector
The time-range selector allows you to limit query results by time period:
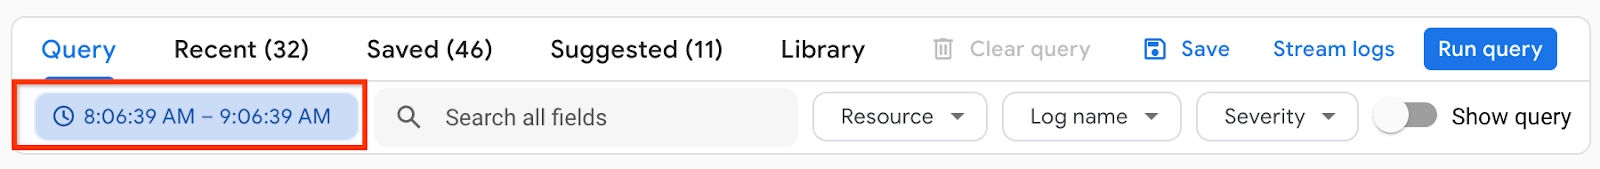
Source: Google Cloud
To use the time-range selector, follow these steps:
-
In the Query pane, click the time-range selector.
-
Choose the time range for which you wish to see logs.
- Click the Apply button. The parameters are shown in the query-editor field.
The Query results window adapts based on the time period you choose.
The time range is set to one hour by default. The Jump to time option allows you to limit and center the time range on a given timestamp.
From the time-range selector, you may choose your regional preferences, including date and time formatting:
-
Select Enter custom range option.
-
Select Change date & time format.
-
Update your language and region choices under the Language & region menu.
- Click Save.
When you reload your browser, your desired date and time format are displayed in Logs Explorer.
Write advanced queries using the Logging query language
In the Logs Explorer query-editor field, you may use the Logging query language to create more advanced queries:
-
Enable Show query if you don't see the query-editor field in the Query pane.
-
Directly enter your query expressions into the query-editor area.
If you enter any search words or parameters in the filter menus, they will display in the query-editor field and be assessed as part of your query expression.
-
After you've finished reviewing your query, click Run query.
The Query results pane displays logs that match your query. The query expression also affects the Histogram and Log fields windows.
Use recent queries
When you run a query, it is added to your Recent queries list, which comprises the last 10,000 unique queries executed in the previous 30 days.
Select the Recent tab in the Query window to see your most recent queries. The following choices are available on the Recent tab:
-
Stream: Select this option to perform the query and stream the results.
-
Run: Choose this option to perform the query.
-
More options
 : Views the query expression and gives you a choice to perform the query or store it in your list of Saved queries. You may also access these choices by simply selecting the query.
To save the query, perform the following steps:
-
Select Save as. The Save query dialog box appears.
-
Fill out the following fields:
- Name (Required): Give your query a name. The length of names is restricted to 64 characters.
- Description (Optional): Provide a description to assist in determining the intent of the query.
- Enable summary fields (optional). Include summary fields and fill in the summary fields you want to see.
-
Truncate summary fields (Optional): Select the number of characters to truncate to and whether truncation occurs at the beginning or end of the fields.
- Click Save query. The query is now saved in your list of Saved queries.
You may also sort and filter your recent queries; the filter looks for text matches in your query phrase.
Save queries
You may retrieve your stored queries via the Saved tab in the Query pane. Saved queries allow you to save query phrases in order to more consistently and effectively examine your logs.
To save a query expression you've created in the query editor, perform the following:
-
In the Query window, click Save. The Save query dialog appears with your query expression in the query-editor field.
-
Fill out the following fields:
- Name (Required): Give your query a name. The length of names is restricted to 64 characters.
- Description (Optional): Provide a description to assist in determining the intent of the query.
- Enable summary fields (optional). Include summary fields and fill in the summary fields you want to see.
-
Truncate summary fields (Optional): Select the number of characters to truncate to and whether truncation occurs at the beginning or end of the fields.
- Click Save query. Your saved queries are listed under the Saved tab.
Click Run to run a previously stored query. Click Stream to execute the query and stream the results.
Your stored queries may also be sorted and filtered; the filter matches the text in your query expression.
Share queries
Shared queries allow Cloud project users to exchange their stored queries with one another. The Saved tab contains a list of shared queries.
You can share queries that you've previously stored or create new ones.
Create a shared query
To build and distribute a query, follow these steps:
-
In the query-editor field, type a query.
-
Click Save.
-
Fill out the fields in the Save query dialog box.
-
Enable Share with project.
- Click Save query.
The Cloud project has now shared your query with its fellow users.
You may share a stored query by doing the following:
-
Choose the Saved tab.
-
You may either choose the query directly or by selecting More options > Edit
 .
.
- Enable Share with project in the Edit query dialog box, then click Update query.
The Cloud project has now shared your query with its fellow users.
View shared queries
Sort the Visibility column such that shared queries are displayed first to see all shared queries quickly:
-
Choose the Saved tab.
-
Click All.
- Sort the Visibility column.
When and how the inquiries are exchanged are indicated in the Visibility column:
-
Shared by me: Queries you've saved and shared with other participants of the Cloud project.
-
Shared: Queries that other Cloud project participants have shared.
- Private: Queries you stored but didn't share with other Cloud project participants.
View only your queries
Click Mine to see stored queries that you have created or shared. A list of your previously created and stored queries is now visible. Your unshared Private queries are listed in the Visibility column. Shared by me is used to indicate queries that you have shared.
Use suggested queries
Logging provides suggested queries based on the context of your Cloud project, such as the Google Cloud products you're using. You may use suggested queries to find problems and gain knowledge about the general state of your systems. For instance, Logging may recommend a query that locates all the error logs for your containers if it determines that you are using Google Kubernetes Engine.
Select the Suggested tab in the Query window to examine and execute suggested queries. The Suggested tab displays a list of suggestions with descriptions and the following choices for each query:
-
Stream: Select this option to perform the query and stream the results.
-
Run: Choose this option to perform the query.
-
More options: Views the query expression and gives you the choice to perform the query or store it in your list of Saved queries. You may also access these choices by simply selecting the query.
Do one of the following actions to go through a recommended query's specifics:
-
Select the query's row.
-
In the More , choose View. The dialog for query information appears.
You can run, stream, or save the query using the options Run, Stream, or Save as in the Query details dialog:
-
Follow these steps to save the query:
- Press Save As.
- The Save query dialog's fields must be filled out.
The modified query appears in your Saved list, where you may decide whether to execute it at a later time.
-
Click Run to run the query right away. The query executes, and the query-editor field shows the results.
-
Click Stream to perform the query right away and stream the outcomes.
- Click Close to close the dialog and go back to the list of suggested queries.
Take note of the following anticipated behaviors:
-
Following page loads may not display the same queries in the same sequence.
-
There may be no recommended queries.
- Running a suggested query might sometimes result in zero logs.
Select queries from the library
Logging includes a query library based on typical use cases and Google Cloud products. These searches can help you identify logs quickly during time-critical troubleshooting sessions and examine your logs to learn more about the logging data available.
To see and run the queries in the library, perform the following:
-
In the Query window, click the Library tab.
-
All queries display broad categories of accessible queries and subsets of questions depending on Google Cloud products. Click on any of the goods to restrict the number of queries displayed.
You may also use the search field to look for available queries by category, description, or query expression.
-
Do one of the following to review a query expression:
- Click on the query's row.
-
Select View by clicking More
 .
.
- You can run, stream, or save the query using the options Run, Stream, or Save as in the Query details dialog:
-
Follow these steps to save the query:
- Press Save As.
-
The Save query dialog's fields must be filled out.
The modified query appears in your Saved list, where you may decide whether to execute it at a later time.
-
Click Run to run the query right away. The query executes, and the query-editor field shows the results.
-
Click Stream to perform the query right away and stream the outcomes.
- Click Close to close the dialog and go back to the list of suggested queries.


 23+ registered

