Do you think IIT Guwahati certified course can help you in your career?
Introduction
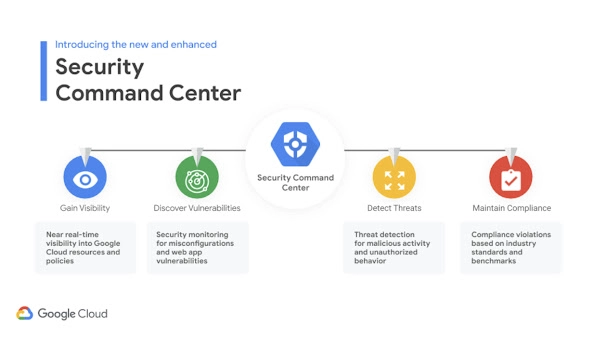
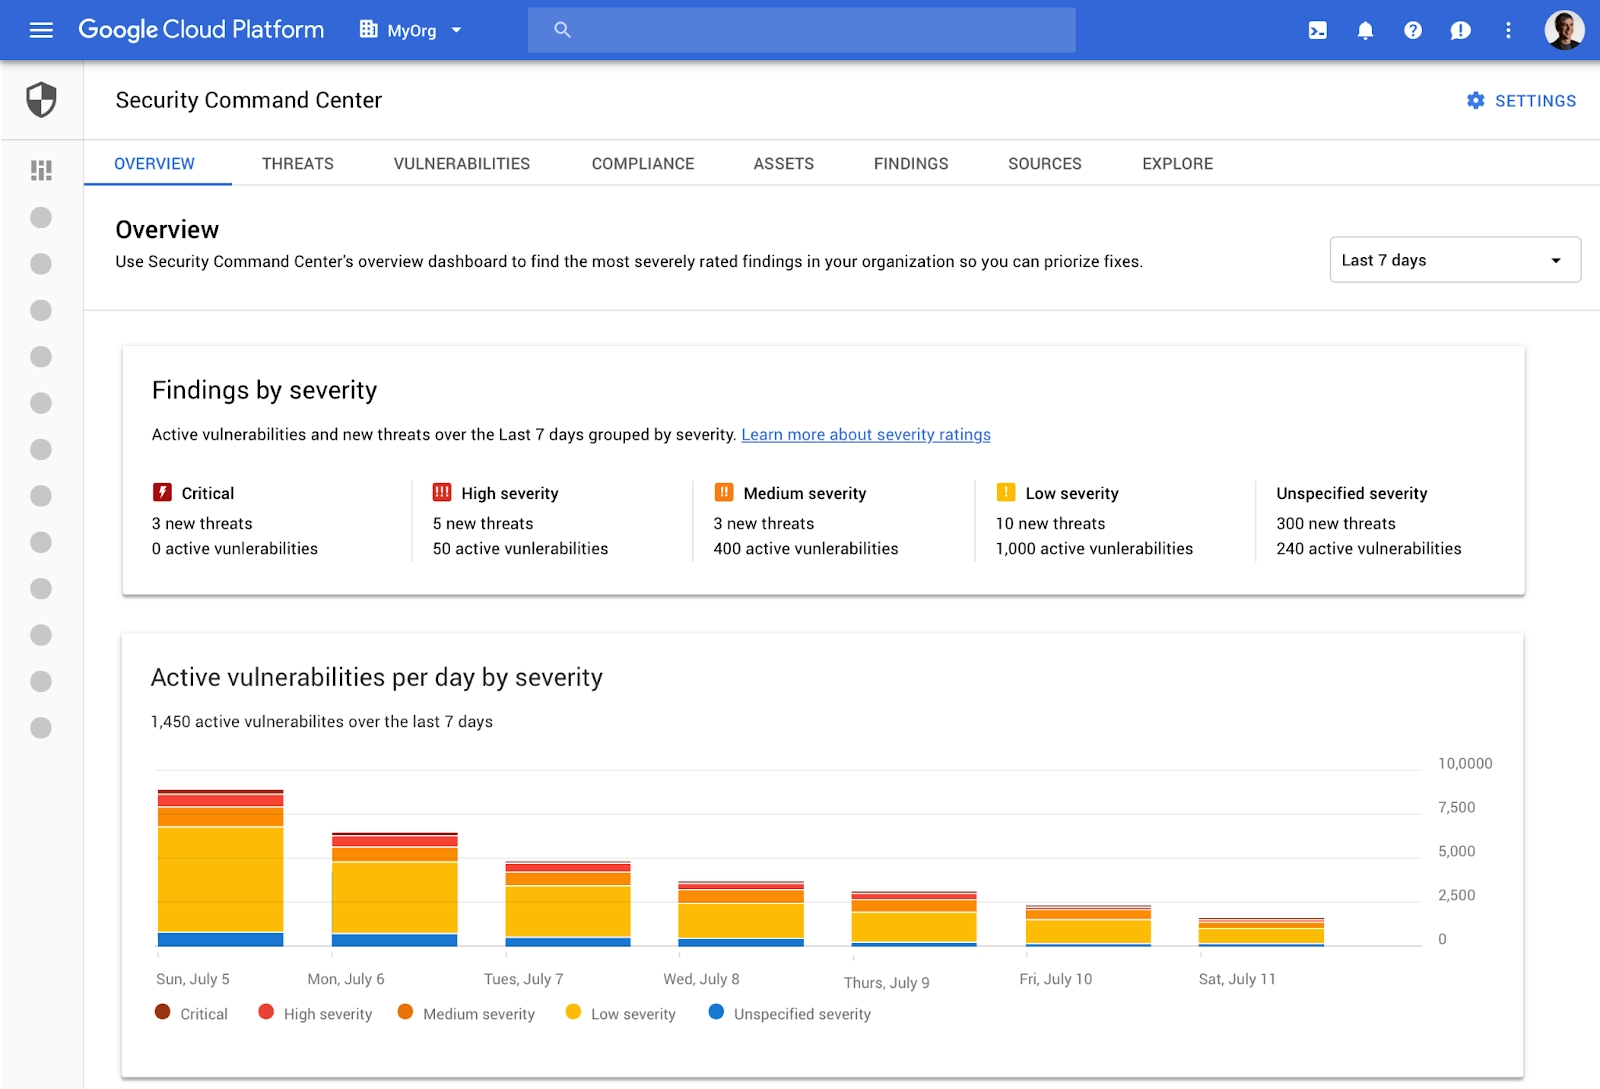
Google Cloud's native platform for security and risk management is called Security Command Center. The Security Command Center continuously monitors your Google Cloud environment, giving you access to information about your resources' vulnerabilities, allowing you to identify threats aimed at your assets, and allowing you to maintaining compliance with industry standards and benchmarks.
Prerequisites
You need an Identity and Access Management (IAM) role with the necessary permissions in order to use Security Command Center:
You may view Security Command Center using Security Center Admin Viewer.
You may see and edit Security Command Center using the Security Center Admin Editor.
You must be logged into the console using an account from an authorized domain if your organization's policies restrict identities based on domain.
Roles for the Security Command Center are assigned at the level of the organization, folder, or project. The amount of access you have determines your capacity to see, edit, create, and update findings, assets, and security sources.
Security Command Center tiers
The built-in Security Command Center services that are accessible for your organization depend on the tier you choose:
Features of standard tiers are as follows:
Security Health Analytics: In the Standard tier, Security Health Analytics offers managed vulnerability assessment scanning for Google Cloud, which may instantly find the vulnerabilities and misconfigurations with the highest severity for your Google Cloud assets. Security Health Analytics offers the following finding types in the Standard tier:
DATAPROC IMAGE OUTDATED
LEGACY AUTHORIZATION ENABLED
MFA NOT ENFORCED
NON-ORG IAM MEMBER
OPEN CISCOSECURE WEBSM PORT
OPEN DIRECTORY SERVICES PORT
OPEN FIREWALL
OPEN GROUP IAM MEMBER
OPEN RDP PORT
Custom scans with Web Security Scanner: Custom scans with Web Security Scanner are supported in the Standard tier for deployed applications with public URLs and IP addresses that aren't protected by a firewall.
Issues in the Security Command Center: The Security Command Center offers detection and remedial advice for configuration errors that prohibit the Security Command Center and its services from operating as intended.
Configuring Security Command Center
Go to the Security Command Center Settings page in the console to customize Security Command Center, and then click the tab for the setting you wish to modify.
Services
Built-in and integrated services are the two services that run on the Security Command Center. A feature of the Security Command Center is built-in services. Google Cloud and other external services that deliver findings to the Security Command Center are examples of integrated services.
Adding a third-party security service
Security Command Center can show findings from outside security providers that have signed up as Cloud Marketplace partners. The following are examples of third-party security services that have already been registered:
Acalvio
Capsule8
Cavirin
Chef
Check Point CloudGuard Dome9
CloudQuest
McAfee
Qualys
Reblaze
Prisma Cloud by Palo Alto Networks
StackRox
Tenable.io
You set up the security service, enable it on the Security Command Center dashboard, and then add a new third-party security service to Security Command Center.
Using Security Health Analytics
A built-in feature of the Security Command Center is Security Health Analytics. Security Command Center Services settings must have Security Health Analytics enabled in order to access the results. The Security Command Center dashboard and Security Command Center API both allow searching for results from Security Health Analytics detectors.
Filtering findings in Security Command Center
There could be a lot of vulnerability findings across a large organization's deployment that needs to be reviewed, prioritized, and tracked. You can review vulnerabilities by asset type, security mark, and more using Security Command Center's filters to concentrate on the vulnerabilities with the highest severity throughout your business.
Viewing Security Health Analytics findings by project
Do the following to view Security Health Analytics results by the project:
Step 1: In the console, select Security Command Center.
Step 2: By selecting the Vulnerabilities tab, Security Health Analytics results will be displayed.
Step 3: Click Add a project to the Projects Filter under Projects Filter (add).
Step 4: Pick the project you want to see results for from the search window that displays.
The findings for the project you chose are listed under the Vulnerabilities tab.
Scanning projects protected by a service perimeter
Follow these instructions to allow incoming access to the Security Command Center service account.
Step 1: Head over to VPC Service Controls.
Step 2: Choose your Google Cloud organization from the toolbar.
Step 3: Select the access policy that contains the service boundary you wish to provide access to from the drop-down list.
Step 4: To access the service perimeter, click its name. Then select Edit Perimeter.
Step 5: Click Ingress Policy in the navigation menu.
Step 6: Click Add rule. The rule should be set up as follows:
Aspects of the API client's FROM
Choose All sources under Source.
Select Selected identities under Identity.
Click Select in the Add User/Service Account area.
Enter the email address for the service account.
Step 7: Press Save.
Access control with IAM
You may manage who can access what assets, information, and security sources in your Security Command Center environment using Security Command Center's IAM roles. You provide roles to users and programs, and each position comes with a set of permissions.
IAM roles can be granted at the organizational, folder, and project levels using Security Command Center Premium. Role grants are only supported by Security Command Center Standard at the organization level.
Organization-level roles
Projects and folders under an organization inherit their responsibilities and permissions when IAM roles are applied at the organization level.
Permissions to view, edit, update, create, or remove resources are part of IAM roles. You can take the specified actions on discoveries, assets, and security sources across your business by using roles provided at the organization level in Security Command Center. A user with the Security Center Findings Editor role (roles/securitycenter.findingsEditor), for instance, has access to see or change any findings that are associated with any resource in any project or folder in your company. You don't need to assign users roles in each folder or project with this structure.
Using Event Threat Detection
Event Threat Detection is an integrated security Command Center Premium tier service that keeps track of your company's Cloud Logging and Google Workspace logging streams and quickly identifies risks.
Reviewing findings
The service must be enabled in the Security Command Center Services settings in order to view Event Threat Detection results. Event Threat Detection produces conclusions after you enable it and enable logs for your company, folders, and projects.
Viewing findings in Cloud Logging
Follow these steps to view Event Threat Detection results in Cloud Logging:
Step 1: Enter the terminal and select Logs Explorer.
Step 2: Choose the project where your Event Threat Detection logs are stored in the Project selection at the top of the page.
Step 3: On the Query builder tab, click.
Step 4: Choose Threat Detector from the Resource drop-down menu.
Select all detector names to view the results from all detectors.
Select a certain detector's name to view its results.
Step 5: Select Add. This search appears in the text field for the query builder:
Step 6: If you prefer, type the following in the text box:
resource.type="threat_detector"
Step 7: Hit "Run Query." The logs you chose are added to the Query results table.
Step 8: Click a table row, expand nested fields, and select a log to display.
Container Threat Detection
Container Threat Detection is a built-in service for the Security Command Center Premium tier that continuously analyses the condition of Container-Optimized OS node images. To identify runtime threats in almost real-time, the service assesses all modifications and attempts at remote access.
The most frequent container runtime threats are found by Container Threat Detection, which notifies you via Security Command Center and, if desired, Cloud Logging.
Working on Container Threat Detection
The guest kernel's low-level activity and running bash scripts are collected by the Container Threat Detection Instrumentation. When events are found, the execution path is as follows:
A detector service receives event information and information identifying the container for analysis. When Container Threat Detection is turned on, the event export configuration is done automatically.
The detector service examines events to assess whether an occurrence is indicative of an incident.
The incident is recorded as a finding in Security Command Center and, optionally, to Cloud Logging if the detector service finds an occurrence.
Setting up custom scans using Web Security Scanner
Utilizing Web Security Scanner in the Google Cloud dashboard, you can plan and execute customized scans on a deployed application. The public URLs and IPs that aren't protected by a firewall can be scanned using Web Security Scanner.
Enabling Web Security Scanner
Step 1: Putting a test project online
You require the URL of an already-deployed Compute Engine, Google Kubernetes Engine (GKE), or App Engine application to finish the Web Security Scanner configuration for custom scans.
Step 2: Choosing IAM roles
You need to be in one of the following Identity and Access Management (IAM) roles for the project you wish to scan in order to use the Web Security Scanner:
Editor and Owner
Step 3: Performing a scan
A scan that you configure is delayed to run later. Depending on the load at the time, it can take several hours for a scan to run.
Step 4: Cleanup
Viewing custom scan results
On the scan details page in the console, the status and outcomes of a custom scan are shown. To see scan outcomes:
Step 1: Use the test account you used to create the scan to log in.
Step 2: Navigate to the console's Web Security Scanner page.
Step 3: Select the project that contains the scan you want to review by clicking Select after doing so.
Step 4: Click the name of the scan you want to review under Scan configs.
Frequently Asked Questions
How does on-demand functionality work with cloud computing?
Cloud computing was developed as a technology with the goal of giving all of its user's access to functionality whenever and wherever they need it. It has accomplished that goal thanks to recent developments and the simplicity with which tools like Google Cloud are accessible.
What cloud storage libraries and tools are available on GCP?
The Google Cloud Platform's cloud storage is based on JSON API and XML API. But in addition to these, Google additionally offers the following to communicate with cloud storage.
Basic operations on objects and buckets using the Google Cloud Platform Console, Libraries for cloud storage that support numerous programming languages, and A CLI for cloud storage are provided by the Gsutil Command-line Tool.
Why is a virtualization platform required to construct a cloud?
You can construct virtual versions of the storage, operating systems, applications, networks, and other technologies using virtualization. If you use virtualization correctly, it can help you upgrade your current infrastructure. On already-existing servers, you can run a variety of applications and operating systems.
Conclusion
In this blog, we discussed the security command center, its prerequisites, configuring it, and its center tiers. We also discussed health analytics, access control with IAM, event threat detection, and container threat detection and it’s working. In the end, We saw Setting up custom scans using Web Security Scanner.


 5+ registered