


Introduction
Vaadin (formerly Vaadin Framework) is a Java web framework for developing web applications and websites. Vaadin's programming model allows developers to use Java as the programming language for implementing User Interfaces (UIs) without directly using HTML or JavaScript.

In this article, we will discuss Vaadin charts. We will start by introducing the basics of the Vaadin charts. Afterward, we will discuss installing Vaadin charts for Vaadin flow, the maven dependency, and the associated license key.
We will also discuss the basic use of vaadin charts by going through basic chart configuration, plot options, chart data series, and axis configuration. At last, we will know how to display multiple series and discussion of mixed-type charts, concluding our discussion of Vaadin charts. So let’s get started!
Charts
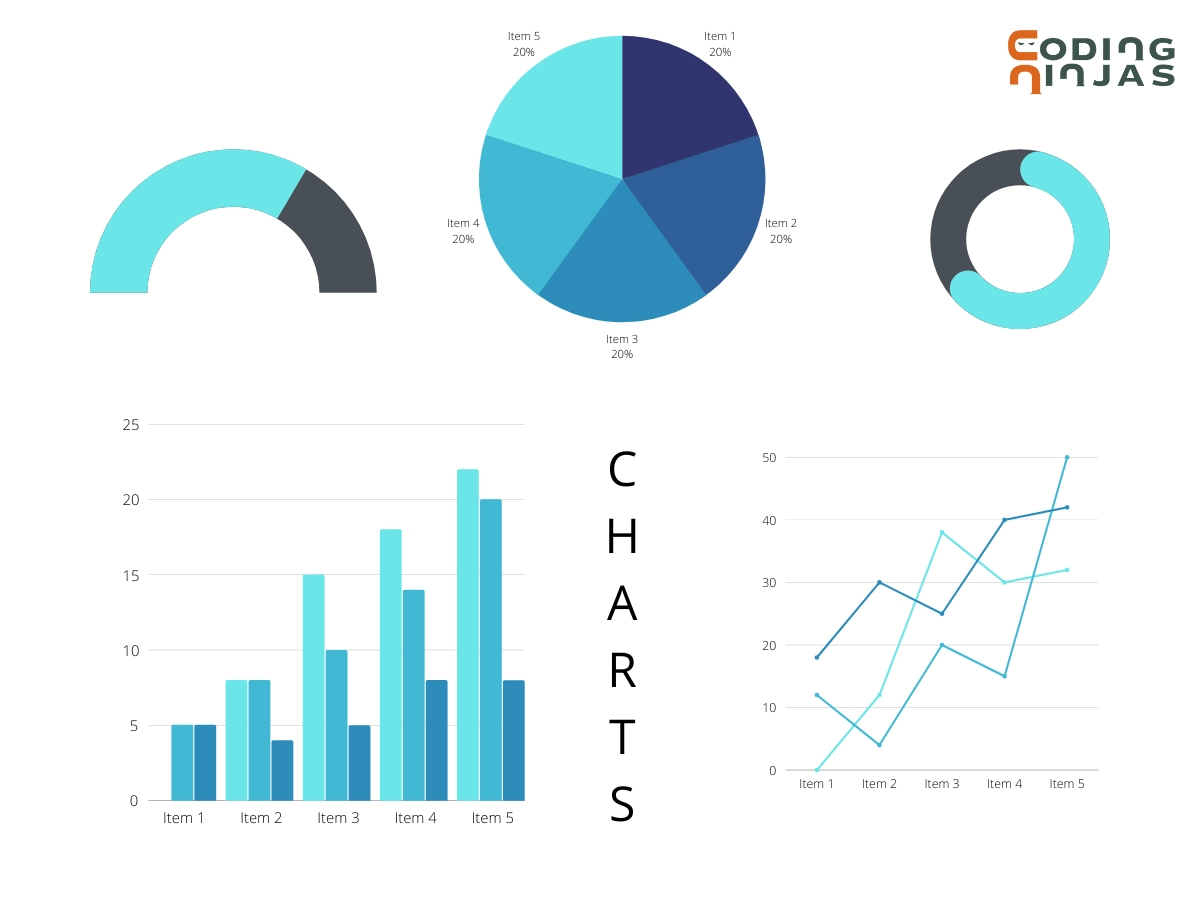
A chart is a graphical representation of data that "represents the data by symbols such as lines in a line chart, the slices in a pie chart, or bars in a bar chart." A chart can represent tabular numeric data, functions, or some types of quality structure and provide various types of information.
Chart tools are powerful, easy to use, and completely free.
Let’s consider the following chart program to better understand Vaadin charts and how to implement them.
render() {
  return html`
// Making Vaadin chart for a column group
    <vaadin-chart
      id="vaadin-chart-1"
      type="column"
      categories='["Jan", "Feb", "Mar"]'
      additional-options='{ "yAxis": { "title": { "text": "" } } }'
    >
      <vaadin-chart-series title="Tokyo" values="[49.9, 71.5, 106.4]"></vaadin-chart-series>
      <vaadin-chart-series title="New York" values="[83.6, 78.8, 98.5]"></vaadin-chart-series>
      <vaadin-chart-series title="London" values="[48.9, 38.8, 39.3]"></vaadin-chart-series>
    </vaadin-chart>


    <vaadin-chart
      type="area"
      stacking="normal"
      categories='["Jan", "Feb", "Mar", "Apr", "May", "Jun", "Jul", "Aug", "Sep", "Oct", "Nov", "Dec"]'
      tooltip
      no-legend
      additional-options='{
        "yAxis": {
          "title": {
            "text": ""
          }
        },


         "xAxis": {
          "visible":false
        },
        "plotOptions": {
          "series": {
            "marker": {
              "enabled": false
            }
          }
        }
      }'
    >


      <vaadin-chart-series
        title="United States dollar"
        values="[135, 125, 89, 124, 105, 81, 111, 94, 95, 129, 98, 84]"
      ></vaadin-chart-series>

      <vaadin-chart-series
        title="Euro"
        values="[62, 72, 89, 68, 94, 92, 110, 100, 109, 89, 86, 105]"
      ></vaadin-chart-series>

      <vaadin-chart-series
        title="Japanese yen"
        values="[30, 25, 32, 26, 15, 31, 24, 32, 21, 8, 12, 32]"
      ></vaadin-chart-series>

      <vaadin-chart-series
        title="Poud sterling"
        values="[32, 21, 8, 12, 32, 21, 12, 30, 25, 19, 26, 15]"
      ></vaadin-chart-series>
    </vaadin-chart>


// Making a pie chart
    <vaadin-chart
      type="pie"
      tooltip
      additional-options='{
        "tooltip": {
          "pointFormat": "{series.name}: <b>{point.percentage:.1f}%</b>"
        },
        "plotOptions": {
          "pie": {
            "allowPointSelect":true,
            "cursor": "pointer",
            "innerSize": "60%"
          }
        }
      }'
    >

      <vaadin-chart-series
        title="Brands"
        values='[
          {
            "name": "Chrome",
            "y": 38
          },
          {
            "name": "Firefox",
            "y": 24
          },
          {
            "name": "Edge",
            "y": 15,
            "sliced": true,
            "selected": true
          },
          {
            "name": "Internet Explorer",
            "y": 8
          }
      ]'
      ></vaadin-chart-series>
    </vaadin-chart>


// Making a polar chart
    <vaadin-chart
      polar
      additional-options='{
        "xAxis": {
          "tickInterval": 45,
          "min": 0,
          "max": 360,
          "labels": {},
          "visible":false
        },
        "yAxis": {
          "min":0
        },
        "plotOptions": {
          "series": {
            "pointStart": 0,
            "pointInterval":45
          },
          "column": {
            "pointPadding": 0,
            "groupPadding": 0
          }
        }
      }'
    >

      <vaadin-chart-series
        type="column"
        title="Column"
        values="[8, 7, 6, 5, 4, 3, 2, 1]"
        additional-options='{ "pointPlacement": "between" }'
      ></vaadin-chart-series>
      <vaadin-chart-series type="line" title="Line" values="[1, 2, 3, 4, 5, 6, 7, 8]">
      </vaadin-chart-series>
      <vaadin-chart-series type="area" title="Area" values="[1, 8, 2, 7, 3, 6, 4, 5]">
      </vaadin-chart-series>
    </vaadin-chart>


    <label>
      Theme:
      <select @change="${this.changeTheme}">
        <option value="">Default</option>
        <option value="gradient">Gradient</option>
        <option value="monotone">Monotone</option>
        <option value="classic">Classic</option>
      </select>
    </label>
  `;
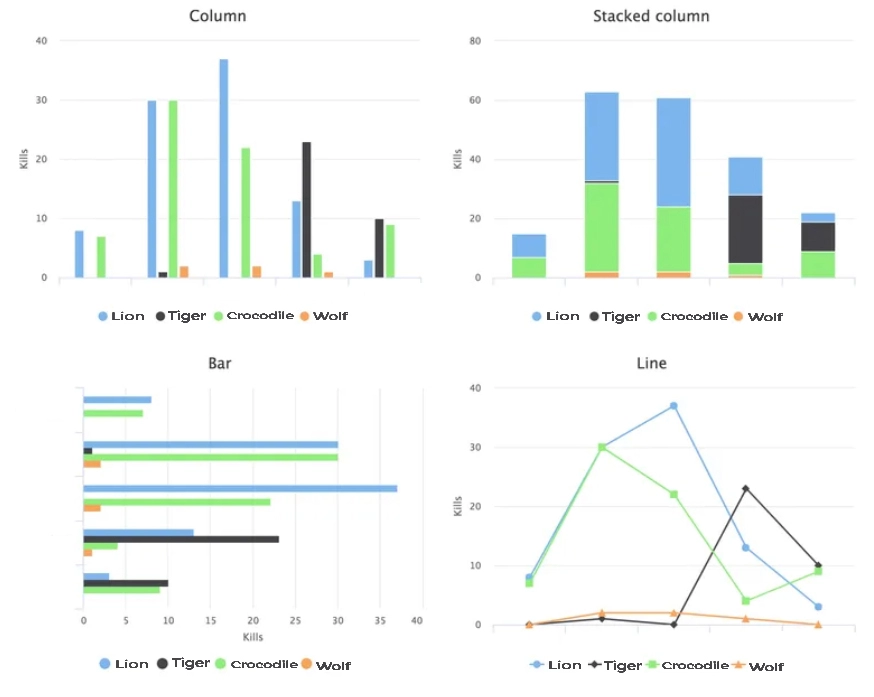
Output:

Installing Charts for Vaadin Flow
Using Vaadin Charts necessitates using a license key, which will be requested during development time after 24 hours of the application being opened for the first time with Vaadin Charts.

 8+ registered

