Do you think IIT Guwahati certified course can help you in your career?
Introduction
Azure App Services are popular for monitoring functionalities of Web Apps, Mobile Apps, and the API Apps built-in within the Azure Portal. The Azure Portal allows one to go through the quotas and metrics for an App and monitor them, set up alerts and autoscaling rules based on the metrics. In this article we will go through the different features provided by Microsoft to monitor our app service. Let us dive straight into the topic.
Quotas
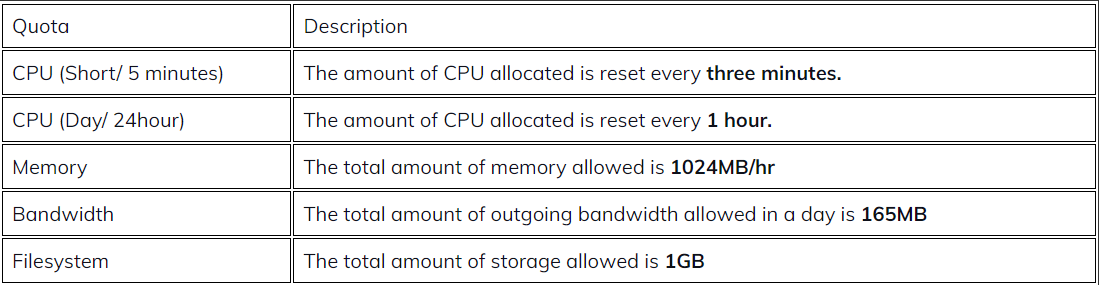
Like the Internet data pack on our mobiles has a daily limit based upon the subscribed plan, similarly, the apps hosted on Azure App Services are subjected to certain limitations on the resources that are available for them to use. It is important to note that the free and shared service plans in the App Services are the most basic tier plan and are generally intended for development and testing purposes. However, they run on the same Azure virtual machine as the other tiers' plans. The limitations on the resources that can be or are available for use are defined by the Quotas. The limitations/ the quota varies from one plan to another. The limitation on the resources on the plan Basic, Standard, or Premium are set by size Small, Medium, Large, and instance count 1,2,3, and so on. Based on the tier/plan, the amount of CPU and memory allocation is decided.
Quotas/ Limitations for Free and Shared Plan are as follows:
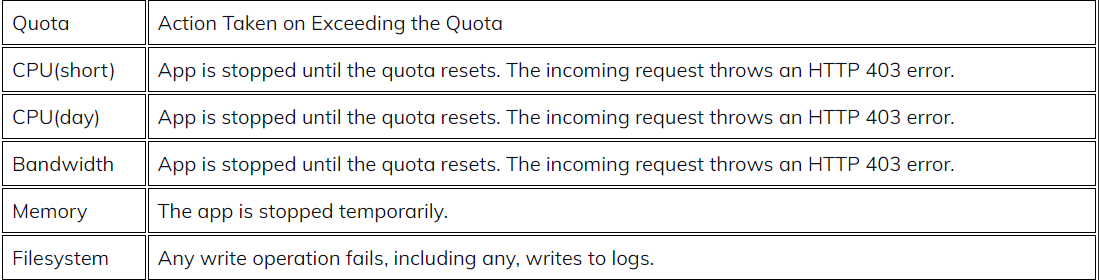
Quota Enforcement
The resources offered in each plan have certain limitations and on exceeding the limitation/ quota the following actions are taken:
The user can always upgrade the plan to the next tier or the premium tier to increase or remove quotas on their App plans for uninterrupted service.
Metrics
The information about an App or the App Service plan’s Behaviour is provided by the metrics. Metrics are provided in the following two ways:
Metrics at the App Service Plan Level: Includes CPU Percentage, Memory Percentage, Data in, Data out, Disc queue length, HTTP queue length, etc.
Metrics at the Application Level: Includes Average Response Time, Average Memory Working Set, CPU time, Data in, Data out, etc.
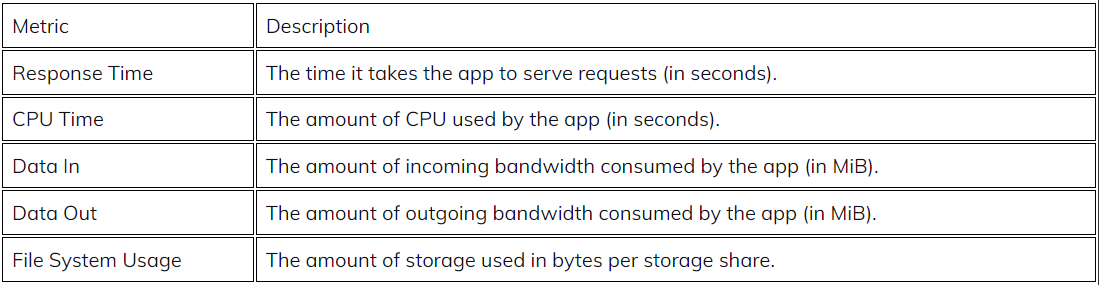
Some of the metrics for an App are as follows:
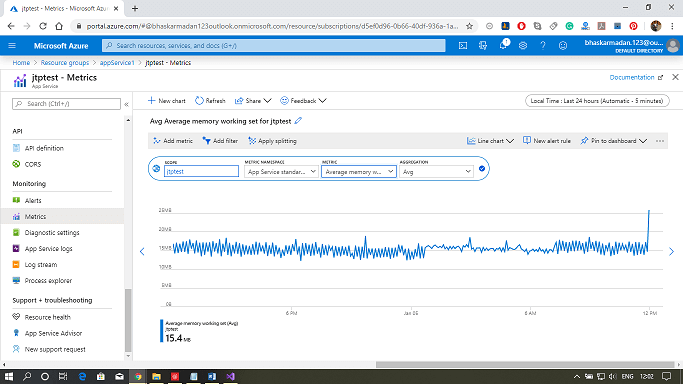
Monitoring Quotas and Metrics in the Azure Portal
To monitor and review the quotas and metrics of an App, you can visit the Azure Portal.
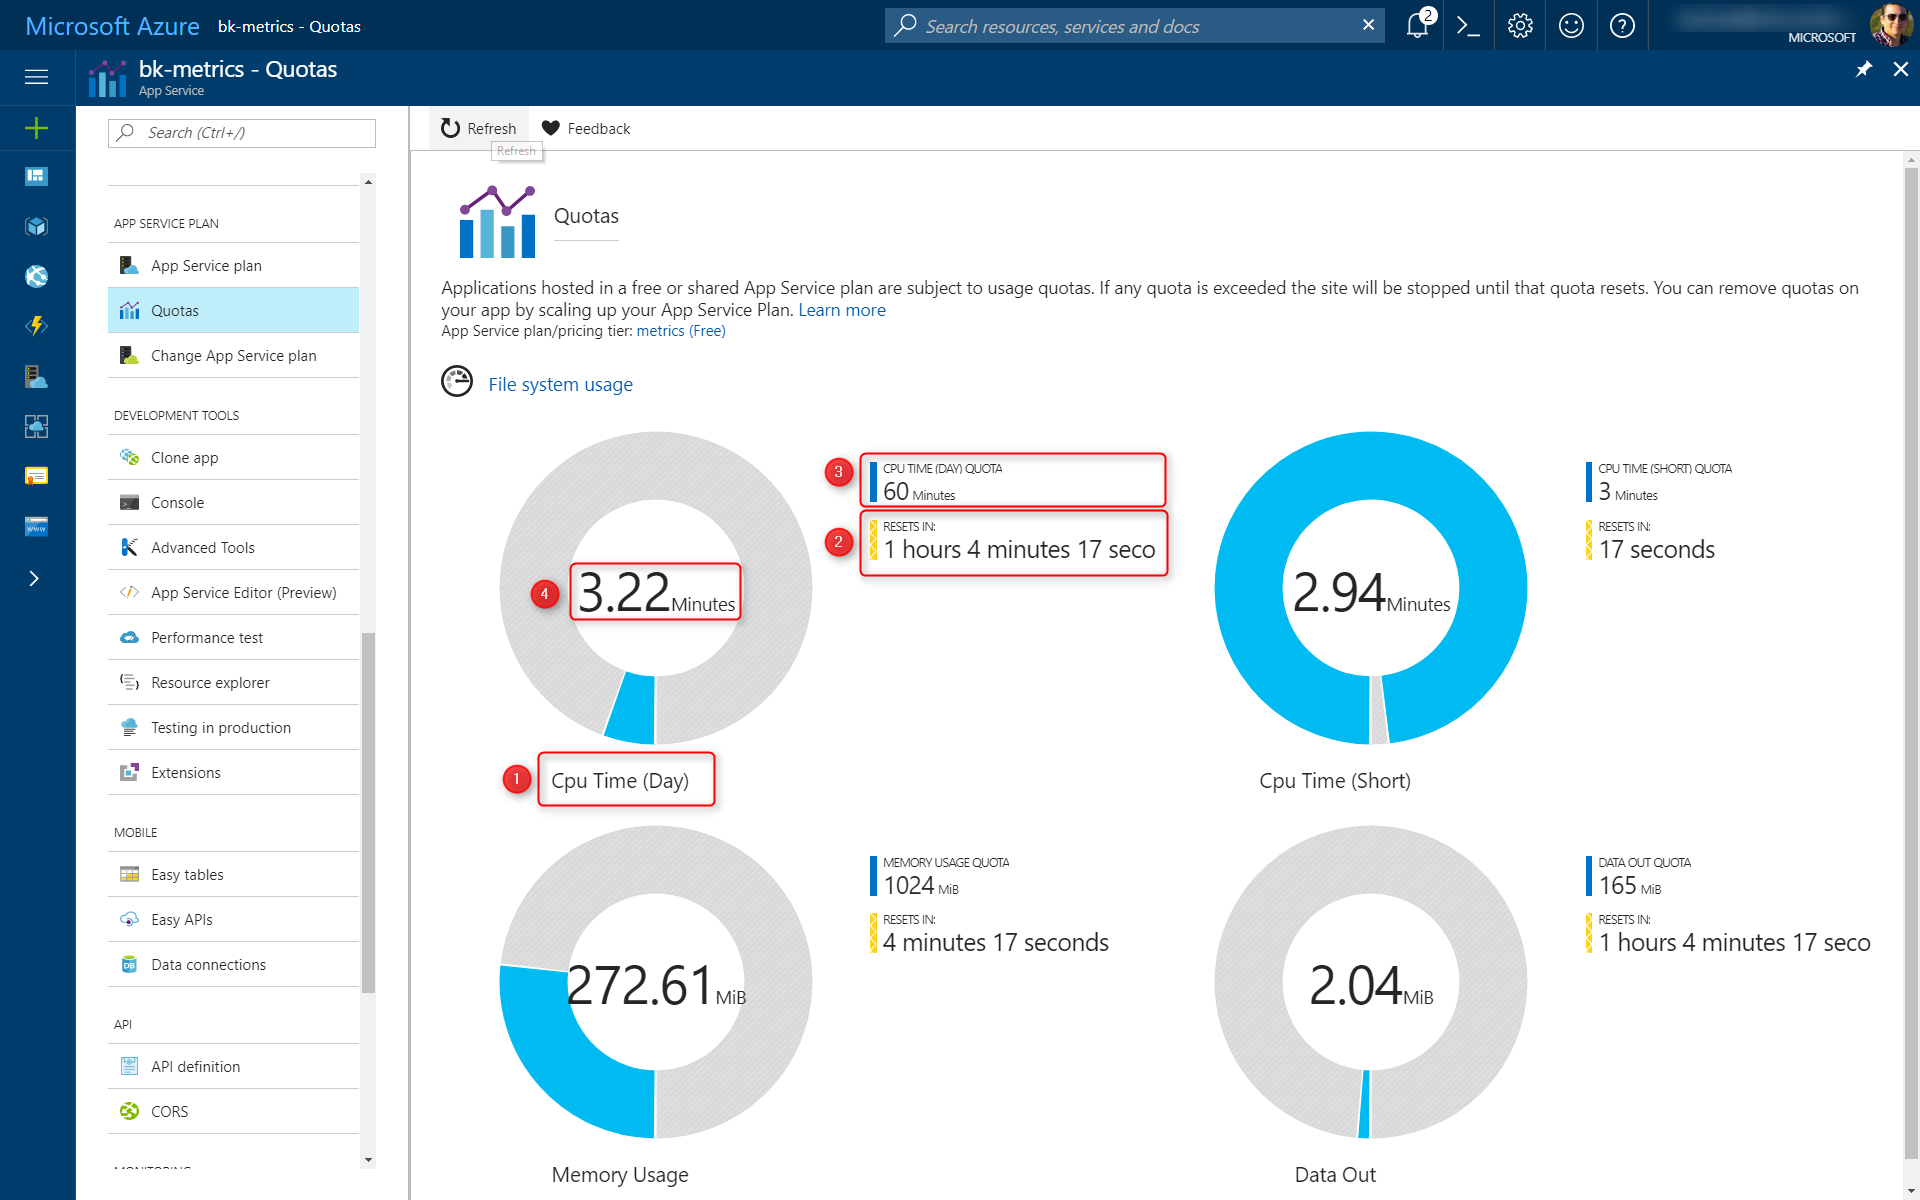
To check the applicable quotas: Select Settings and then Quotas. You can check the Quota name, reset interval, current limit, and current value.
Metrics can be directly accessed from the resource overview page. Charts representing various metrics over an App can be reviewed.
Alerts and Autoscale
Metrics for an app or App Service plan can be hooked up to alerts. A Basic or higher App Service plan supports autoscaling for App Service apps. With autoscale, you can configure rules that monitor App Service plan metrics. If additional resources are needed, rules can increase or decrease the instance count. When the App is over-provisioned, rules can also help you save money.
Diagnostics
App service web apps provide diagnostic functionality for logging information from both the web server and the web application. Web server diagnostics and application diagnostics can be logically separated.
Web server Diagnostics: In this, we can have a detailed error logging, which is any Http 400, and the above error will get logged. We can also view the logs. And the second thing is failed request tracking, which contains the trace of IIS components used to process our request. And the third one is web server logging. These are the overall metrics on how many HTTP requests we received and from a particular IP address.
Application Diagnostics: It allows us to capture the information produced by the web application. So if we're using a system diagnostic trace, all the information will be provided by application diagnostics.
You can store diagnostic information in the file system or Azure storage.
Frequently Asked Questions
Differentiate CPU Time and CPU Percentage?
CPU use can be represented by two metrics:
CPU Time is useful for apps hosted on Free or Shared plans because one of their quotas is determined in CPU minutes utilized by the app. CPU percentage is useful for apps hosted on the Basic, Standard, and Premium tiers because they can be scaled out. CPU percentage is a decent indicator of overall use across all instances.
Define Granularity in Azure App Service Metrics?
Granularity defines the level of details, a set of metrics provided to understand the various usage and working of the App.
Define Retention in Azure App Service Metrics?
Retention defines the amount of time the metrics are available to a user.
Conclusion
In this article, we have extensively discussed the different features provided by Microsoft to monitor our app service. Having gone through this article, I am sure you must be excited to read similar blogs. Coding Ninjas has got you covered. Here are some similar blogs to redirect: How to Prepare for a Microsoft Azure Certification Exam?, Microsoft Azure, AWS Vs Azure Vs Google Cloud?, Microsoft Azure Certification. We hope this blog has helped you enhance your knowledge, and if you wish to learn more, check out our Coding Ninjas Blog site and visit our Library. Here are some courses provided by Coding Ninjas: Basics of C++ with DSA, Competitive Programming, and MERN Stack Web Development. Do upvote our blog to help other ninjas grow. Happy Learning!


 9+ registered

