Do you think IIT Guwahati certified course can help you in your career?
Introduction
Metrics are numerical values. They get collected automatically at constant intervals and describe several aspects of a resource. A metric might convey the virtual machine’s processor utilization, the free space in a storage account, or a virtual network’s incoming traffic.
It is a feature of Azure Monitor in the Azure portal that enables users to create charts from metric values, correlate trends visually , and investigate crust and troughs in metric values.
So, in this article, we will discuss Azure Metrics Explorer in detail.
Getting started with Microsoft Azure Metrics Explorer
Azure Monitor metrics explorer is one of the components of the Microsoft Azure portal that allows chart plotting, correlating trends visually, and investigating ups and downs in metrics' elements.
Standard metrics are offered by the Azure platform. They convey the usage and health statistics of the Azure resources.
Creating the Metric Chart
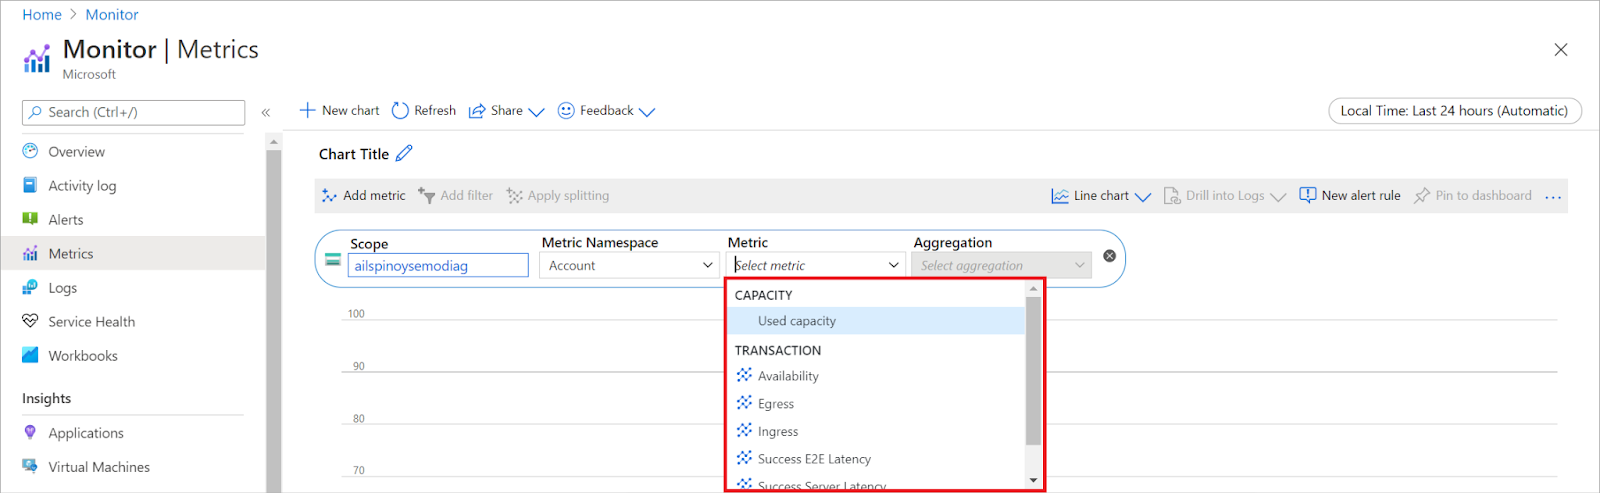
From the resource, resource group, subscription, and Azure Monitor view, to create a metric chart open the Metrics tab and follow the below steps:
Select the "Select a scope" button and open the resource scope picker. This enables selecting the resource(s) whose metrics are to be seen from your resource, resource group, subscription, or Azure Monitor view. The resource must already be populated if metrics explorer is opened from the menu of the resource.
For a few resources, a namespace must be picked. The namespace is basically a way to organize metrics so that you can easily find them. For instance, storage accounts have separate namespaces for storing Tables, Files, Blobs, and Queue metrics. Several resource types have one namespace only.
Select a metric from the metrics list available.
Optionally, the metric aggregation can also be changed.
Selecting a Time Range
The chart shows the most recent twenty-four (24) hours of metrics data by default. Time Picker Panel is used to change the time range, zoom out, or zoom in on the chart.
Applying dimension splitting and filters
Splitting and filtering are powerful diagnostic tools for the metrics with dimensions. These features tell how various metric segments or dimension values affect the overall value of the metric and allow identifying possible outliers.
Splitting controls the chart displays - aggregates the values into a single line or separate lines for each value of a dimension. Applying splitting to see separate lines on the server instance dimension may be required.
Filtering allows choosing which dimension values are included in the chart. Applying the filter to the dimension success may be required.
Sharing the Metric Chart
There are three ways to share the Metric Chart as follows:
Downloading to Excel
Select "Share" and "Download to Excel". The download will start immediately.
Sharing the link
Select "Share" and "Copy link". A notification that the “Link is copied successfully” will appear.
Sending to the Workbook
Select "Share" and "Send to Workbook". The “Send to Workbook” window opens in order to send the metric chart to an existing or new workbook.
Advanced features of the Azure Metrics Explorer
A few advanced features of the Azure Metrics Explorer are as follows:
Resource Scope picker
The resource scope picker enables viewing metrics across multiple resources and single resources. The below sections explain the usage of the resource scope picker.
Selecting a single resource
Choose Metrics from the Monitoring section of a resource's menu or from the Azure Monitor menu. Then click “Select a scope” to open the scope picker.
To select the resources metrics you want to see, use the scope picker . The scope must be populated if you opened the Azure metrics explorer from a resource's menu.
For some resources, only one resource's metrics at a time can be viewed. These resources lie in the “All resource types” section in the Resource types menu.
After selecting a resource, all subscriptions and resource groups that contain that resource can be seen.
After making a satisfactory selection, select Apply.
Viewing metrics across multiple resources
Several resource types can query for metrics for multiple resources. The resources should be within the same location and subscription. These resource types can be found at the top of the Resource types menu.
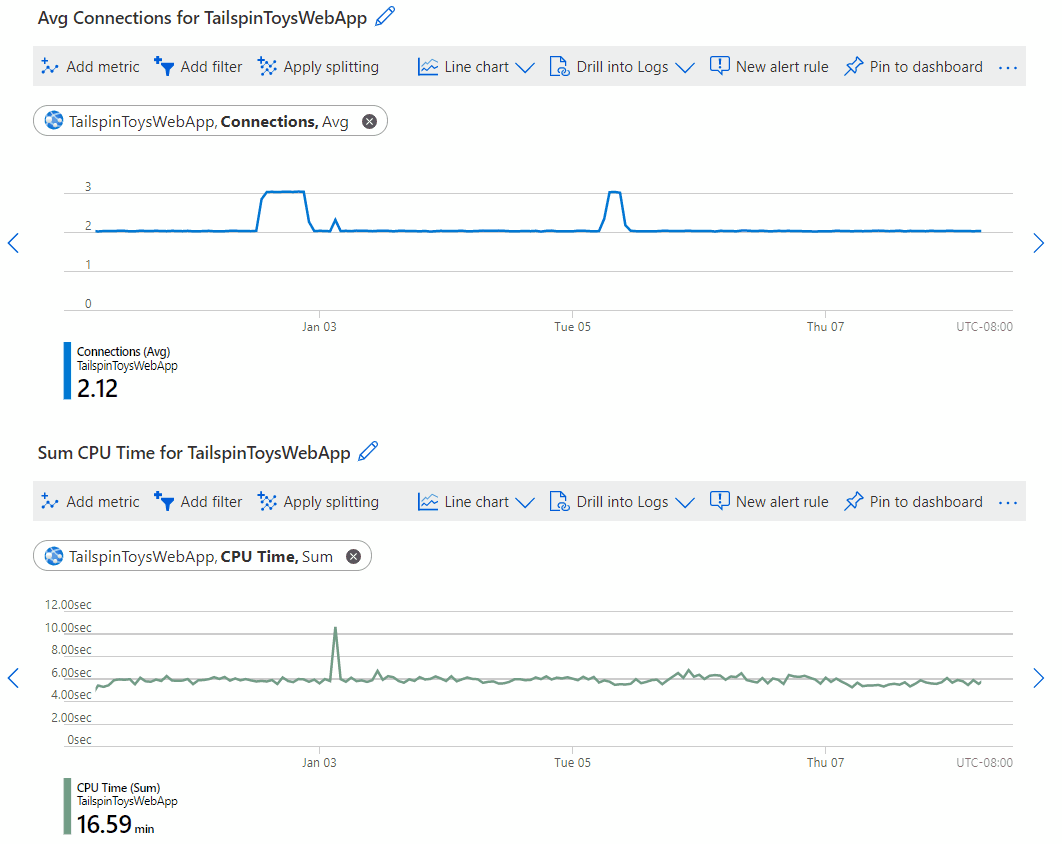
Multiple metric lines and charts
The charts that plot multiple metric lines or show multiple metric charts at the same time can be created in the Azure metrics explorer. This functionality enables the following:
Correlating related metrics on the same graph to check how one value relates to another.
Displaying metrics that use different units of measure in close proximity.
Visually aggregating and comparing metrics from multiple resources.
Time range controls
Pan and Zoom can be used to do control in the chart area, in addition to changing the time range from the time picker panel.
Pan works in the following ways:
Zoom works in the following way:
Filters
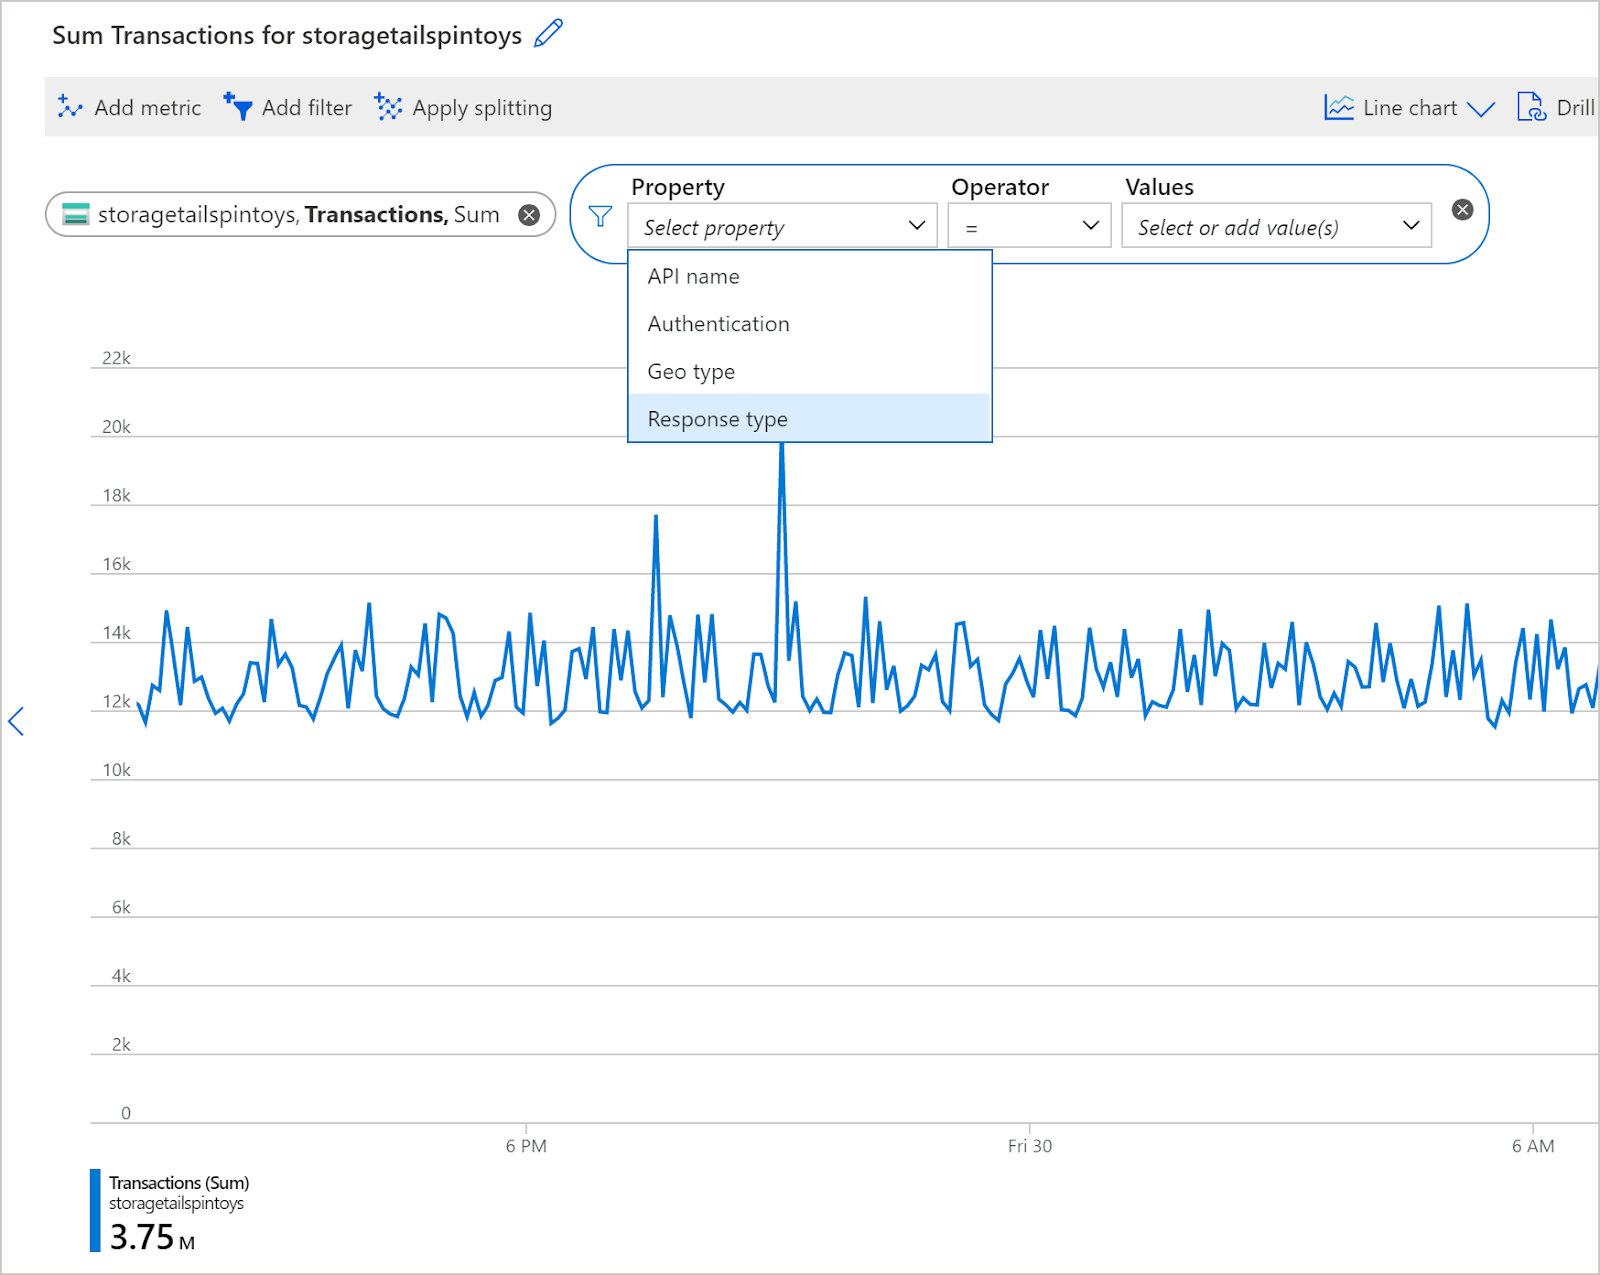
Filters can be applied to charts with metrics that have dimensions. For example, for a "Transaction count" metric that has a "Response type" dimension, this dimension indicates whether the response from transactions failed or succeeded. If the filter is done on this dimension, a chart line for only successful (or only failed) transactions can be seen.
Add a filter
Select Add filter above the chart. After this, select a property (dimension) to filter.
Select the operator to apply against the property(dimension). The default operator is equal (=).
Select the dimension values to apply to the filter while plotting the chart.
After selecting the filter values, click off from the Filter Selector to close it. Now the chart shows the number of storage transactions that have failed:
Repeat the above steps to apply multiple filters to the same charts.
Aggregation
When a metric is added to a chart, the metrics explorer applies a default aggregation automatically. Different aggregations can be used to gain more insights into the metric.
Let us first see how the metrics explorer handles them.
Metrics are a series of metric values or measurements that are captured over a time period. When a chart is plotted, the values of the selected metric are aggregated separately over the time grain.
The size of the time grain is selected by using the metrics explorer's time picker panel. If the time grain is not explicitly selected, the currently selected time range by default is used. After the time grain is calculated, the metric values that were captured during every time grain are aggregated on the chart, a single data point per time grain.
The metrics explorer has five basic statistical aggregation functions: count, sum, average, min, and max.
Line colors
The chart lines are assigned a color automatically from a palette by default. These colors can be changed.
To change the chart line color, the colored bar in the legend that corresponds to the chart is selected. The color picker dialog box opens. The color picker is used to configure the line color.
Viewing multiple resources in the Azure Metrics Explorer
The resource scope picker allows viewing metrics across multiple resources that are within the same subscription and region.
Selecting a single resource
Select Metrics from the Monitoring section of a resource's menu or the Azure Monitor menu. Then to open the scope picker, Select a scope.
To select the resources whose metrics, use the scope picker have to be seen. The scope should be populated if you open the metrics explorer from a resource's menu.
Select multiple resources
Several resource types can query for metrics over multiple resources. The metrics should be within the same subscription and location. These resource types can be found at the top of the Resource types menu.
Selecting a resource group or subscription
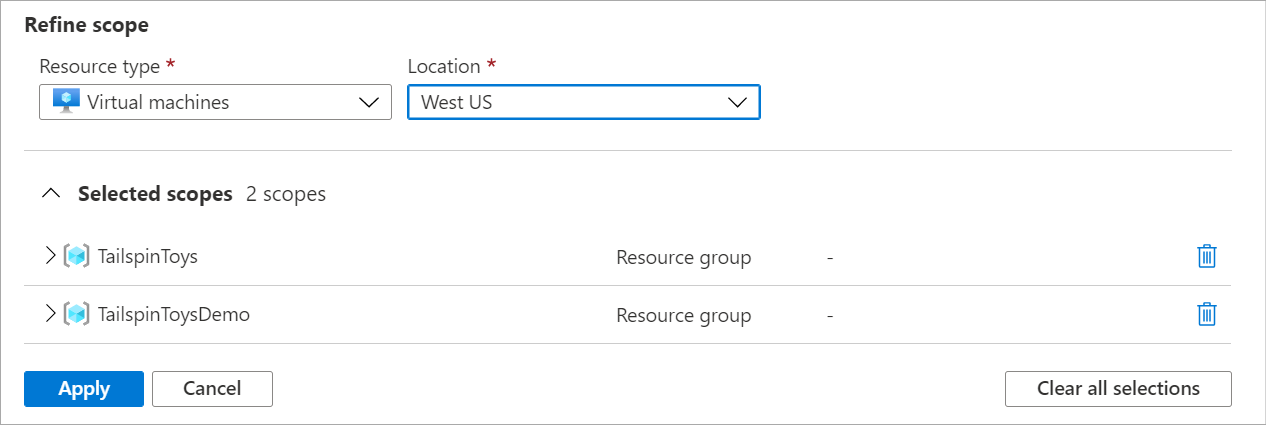
For those types that are compatible with multiple resources, query for metrics across multiple resource groups or a subscription. Starting with the selection of a subscription or one or more resource groups:
Select a location and resource type.
The selected scopes can be expanded to verify the resources of the selections apply.
Splitting and filtering by resource group or resources
The same has been discussed earlier in this article.
Frequently Asked Questions
What is Microsoft Azure?
Microsoft Azure often referred to as Azure, is a cloud computing service offered by Microsoft for application management through Microsoft-managed data centers.
Mention a few Microsoft Azure Services.
A few of the Microsoft Azure Services are:
Analysis Services
Bot Service
Cognitive Search
Data Catalog
Azure Batch
Cosmos DB
App Service And many more
Where does Azure Monitor get its data?
Azure Monitor collects its data from various sources, including metrics and logs from the Azure platform and resources, custom applications, and agents processing on virtual machines.
Conclusion
This article extensively discusses the concept of Azure Metrics Explorer in detail with its basic and advanced features.
If you want to test your competency in coding, you may check out the Mock Test Series and participate in the Contests organized on Coding Ninjas Studio! But if you have just started your learning process and are looking for questions asked by tech giants like Amazon, Microsoft, Uber, etc; you must look at the Problems, Interview Experiences, and Interview Bundle for placement preparations.
Nevertheless, you may consider our Courses to give your career an edge over others!


 8+ registered

