Do you think IIT Guwahati certified course can help you in your career?
Introduction
You can increase the availability and efficiency of your applications and services with Azure Monitor. Thanks to this comprehensive solution, the analytics from your cloud and on-premises systems can be collected, analyzed, and used to take action. In this article, we shall be learning more about Azure Monitoring.
Azure Monitor
With Azure Monitor's aid, you can increase your applications' and services' availability and performance. It offers a complete solution for gathering, examining, and acting on information from your on-again and cloud settings. With this information, you can understand in a better way how your apps are functioning and proactively spot problems that could negatively impact them and the resources they rely on.
Here are a few examples of things you can accomplish using Azure Monitor:
Application Insights, problems across applications, and dependencies may be found and diagnosed.
Link infrastructure problems to VM and container insights.
Use Log Analytics to delve into your monitoring data for thorough diagnostics and troubleshooting.
Automated actions can support operations at scale.
Azure dashboards and workbooks can be used to create visualizations.
Utilize Azure Monitor Metrics to gather information from resources under observation.
Utilize change analysis to look at change data for routine monitoring or issue triage.
Overview
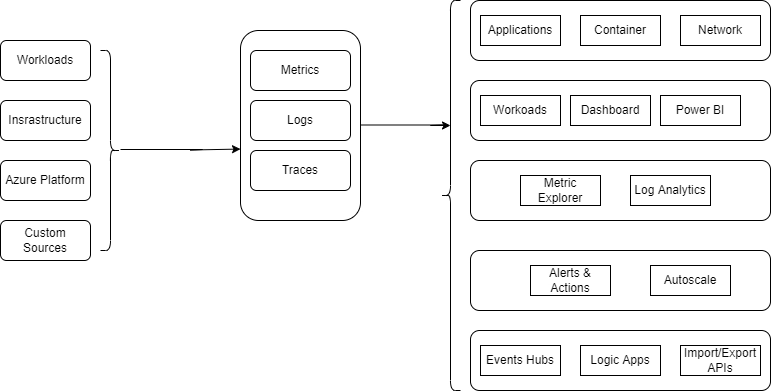
A high-level representation of Azure Monitor is shown in the diagram below. The two primary forms of data that Azure Monitor uses are metrics and logs, and these data storage are located in the middle of the figure. The monitoring data sources that fill these data repositories are shown on the left. The various tasks that Azure Monitor carries out with this data are shown on the right. Analysis, alerting, and streaming to external systems are examples of actions.
Monitor data platform
The two primary forms of data that Azure Monitor collects are metrics and logs. Metrics are numbers that represent a particular characteristic of a system at a specific time. They can accommodate near-real-time scenarios and are lightweight. Different data types are arranged into log records and have unique attributes. Performance information and instrumentation, such as events and traces, are both preserved as logs so they can be merged for analysis.
You may access data gathered by Azure Monitor for numerous Azure resources directly on their overview page in the Azure portal. For instance, you may find various charts that show performance data on any virtual machine (VM). Select any graphs to view the data in Metrics Explorer on the Azure portal. You may graph the values of various metrics across time using Metrics Explorer. The charts can be viewed interactively or pinned to a dashboard to see alongside other visualizations.
Queries can be used to quickly acquire, gather, and evaluate log data that Azure Monitor has collected. Use the Azure portal's Log Analytics to design and test queries. Following that, you can either use various tools to evaluate the data directly or save queries for use with visualizations or alert rules.
Azure Monitor employs a Kusto Query Language variant that supports basic log queries and more complex features like aggregations, joins, and intelligent analytics. Using numerous courses, you may quickly understand the query language. Users who are already familiar with SQL and Splunk receive special training.
What data does Azure Monitor collect?
Azure Monitor may gather data from all of these sources. Each of the following levels of data is collected by Azure Monitor:
Application monitoring data: Information on the functionality and operation of the code you have developed, irrespective of the platform.
Guest operating system monitoring data: Information on the operating system that your application is using. The system may be operating on-site, in Azure, or in another cloud.
Azure resource monitoring data: Information on how an Azure resource is performing.The help with metrics or logs is all included here.
Azure subscription monitoring data: Statistics on the management and operation of an Azure subscription and data on the health and performance.
Azure resource change data: Information about modifications to your Azure resources and how to handle and prioritize incidents and problems.
Insights and curated visualizations
Data monitoring is only beneficial if it can give you more insight into how your computing environment is functioning. You can get a unique monitoring experience for a given service or group of services from several Azure resource providers thanks to their "curated visualizations." Most of the time, a little configuration is needed. The Azure interface and the documentation refer to more extensive, scalable, curated visualizations as "insights" and label them accordingly.
Application Insights
Whether your web apps are hosted in the cloud or on-premises, Application Insights keeps an eye on their availability, performance, and consumption. It uses the robust data analysis framework in Azure Monitor to give you in-depth knowledge of your application's operation. Without awaiting a user report, you can utilize it to diagnose issues. Application Insights interacts with Visual Studio and offers connection points to various development tools to support your DevOps procedures.
Container Insights
The efficiency of workloads delivered in containers to managed Kubernetes clusters hosted by the Azure Kubernetes Service is monitored by container insights. Gathering metrics from controllers, nodes, and containers accessible in Kubernetes through the Metrics API provides performance visibility for you. Additionally, container logs are gathered. These metrics and logs are automatically accumulated for you by a containerized version of the Log Analytics agent for Linux after you enable monitoring from Kubernetes clusters.
VM Insights
VM insights scale-up monitor your Azure VMs. Your Windows and Linux virtual machines' health and performance are analyzed, and their various processes and interrelated dependencies on other methods are identified. The solution supports monitoring application dependencies and performance for VMs hosted on-premises or with another cloud provider.
Respond to critical situations
An efficient monitoring solution must proactively address essential circumstances discovered in the data it collects and enable you to analyze monitoring data interactively. An administrator looking into a problem may receive a text message or email in response. Alternately, you could start an automated procedure that tries to fix an incorrect state.
Alerts
Azure Monitor's alerts proactively alert you to dangerous situations and may even attempt to fix them. Metric-based alert rules deliver alerts based on numerical quantities very close to real-time. Log-based controls enable extensive logic over data from various sources.
Alert rules use action groups in Azure Monitor. These groups contain specific recipients and actions that can be used throughout several regulations. Action groups can carry out tasks like integrating with your IT service management systems or using webhooks to have alerts launch external activities, depending on your needs.
Autoscale
With autoscale, you can run the ideal number of resources to support the load on your application. Create rules to decide whether to automatically add resources when the load grows based on measurements received by Azure Monitor. Spend less money by getting rid of unused resources. You define the logic for when to increase or reduce resources and the minimum and the maximum number of instances.
Visualize monitoring data
Visualizations like charts and tables are helpful tools to summarise monitoring data and convey it to various audiences. When disseminating monitoring data to multiple audiences, Azure Monitor uses other Azure services in addition to its features for data visualization.
Dashboards
You can integrate many data types into a single pane on the Azure interface using Azure dashboards. Sharing the dashboard with other Azure users is an option. Any log query's or metrics chart's output can be added to an Azure dashboard. The production of a log query, a table of activity logs, a usage chart from Application Insights, and a metrics graph, for instance, might all be combined into a dashboard using tiles.
Workbooks
In the Azure site, workbooks offer a versatile platform for data analysis and creating stunning visual reports. They allow you to connect to many data sources throughout Azure and combine them to develop cohesive interactive experiences. Utilize the workbooks with Insights or make your own using pre-made templates.
Power BI
A business analytics solution, Power BI, offers interactive visualizations of data from many sources. It helps make data accessible to people inside and outside your organization. Power BI can be set up to automatically ingest log data from Azure Monitor to benefit from these visualizations.
Frequently Asked Questions
What is Azure Monitor?
The performance and availability can be your cloud and on-premises resources and applications by using the comprehensive capabilities for metrics collection and analysis offered by Azure Monitor, which now also includes Log Analytics and Application Insights.
What is an Azure Monitor agent?
Supports virtual machines in Azure, other cloud environments, and on-premises via the Azure Monitor agent. Transmits information to the Azure Monitor Metrics and Logs. It will replace the Log Analytics agent and diagnostic extension once it fully covers VM insights, Azure Security Center, and Azure Sentinel.
What are application insights in Azure Monitor?
Whether your web apps are hosted in the cloud or on-premises, Application Insights keeps an eye on their availability, performance, and consumption. It uses the robust data analysis framework in Azure Monitor to give you in-depth knowledge of your application's operation.
Conclusion
In this article, we have exhaustively covered Azure Monitor. In this topic, we have discussed what an Azure Monitor is. We also discussed its overview along with the Azure Data Platform. We also discussed what data Azure Monitor collects. We also discussed how the Azure Monitor responds when a critical situation arises. We also discussed the Visualize monitoring data.
If you want to explore more about Azure, visit here.


 8+ registered

