Do you think IIT Guwahati certified course can help you in your career?
Introduction
Hello Ninjas!! Welcome to yet another article on Puppet. Today we will be learning the Basics of Reporting and monitoring in Puppet. The Puppet console provides many tools to monitor the states and check the planned or unplanned changes in your Puppet code.
In this article, We will cover the run status which are used to monitor the infrastructure states, and the filters that are used on the status page. We will also learn about Packages and how we can enable or disable Package data collection.
Sounds a bit complex? Sit back and relax; Let’s start with learning about Puppet.
Puppet
Puppet is an open-source systems tool that is used for configurational management. It is used to configure, deploy, and manage servers.
Puppet can be used on various platforms like IBM mainframes, Mac OS servers, and Cisco routers. It gives you control over your configured computers, so centralized changes are immediately propagated to everyone.
Now let’s move forward by understanding the Basics of Reporting and monitoring.
Monitoring and Reporting
Puppet provides various tools which can be used to monitor the Puppet code, view reports, and investigate problems. You can customize the built-in processors in Puppet.
Puppet offers the capability to specify the software and configuration that a system needs and maintain the given state after initialization of setup. After applying a catalog, Puppet creates a report containing the Run's details, including events, log messages, resource status, metrics, and metadata. To set configuration options for a particular environment or infrastructure, you utilize a declarative Domain Specific Language ( DSL ) akin to Ruby.
Monitoring Infrastructure State
In this section, we will learn about infrastructure states, node’s run status, different types of filters, and Puppet Enterprise (PE) services.
Nodes can be used to fetch configurations from the primary server and send back inventory data and a report of their run, which can be viewed on the Status page. It displays the node's most run status and helps you identify the problems and their causes. The Status page also describes the outcomes of Puppet runs in the infrastructure.
Node Run Status
Now, We will learn about node run status in two different modes. The possible status depends on the Puppet run mode and is different for the enforcement and no-op modes. Let’s first discuss the node’s run status in enforcement mode.
Nodes Run in Enforcement Mode
Let us first understand what an enforcement mode is. This mode supports manual configuration changes on the server, and Puppet can overwrite the existing infrastructure. Following are the nodes run in enforcement mode:
With Failures
This usually happens when a Puppet tries to access a particular resource, an error occurs, or the node’s last Puppet run fails. Another reason for this problem can be the primary server preventing the node’s agent from confirming the node’s compliance.
With Corrective Changes
This reporting is only available on Puppet Enterprise(PE) 2016.4 and later. In this type of reporting, Puppet can correct inconsistencies between the node’s configuration and the last applied catalog.
With Intentional Changes
The changes are updated in the document containing the node’s desired state for each resource, also called the catalog.
Unchanged
If the node’s last puppet run is successful, then there is no need to make any changes.
Nodes Run in no-op Mode
no-op mode means no operation or do nothing. Puppet will only report what it would do, but it doesn’t do any operations if we run in no-op mode. Only agent nodes running PE 2016.4 or more can report in no-op mode.
Let’s see the nodes run in no-op mode:
With Failures
This will happen when the previous no-op Puppet run fails or runs into an issue that prohibits Puppet from simulating changes.
Would have Corrective Changes
This is the same as we discussed in enforcement mode; puppet would correct the inconsistencies between the node’s configuration and the last applied catalog.
Would have Intentional Changes
The changes will be updated in the catalog. A catalog is a document that contains the node’s desired state for each resource.
Would be Unchanged
There will be no need to change if the last Puppet run in no-op mode is successful.
Nodes not reporting
This occurs when either node is not reporting to the server or submitting any Puppet report. Let's look at the status and how to fix them.
Unresponsive
There might be a problem if the node hasn’t reported to the primary server recently. We can find all the timestamps of the node’s Puppet run. We can check for the last known Puppet run. We need to solve this issue to continue our Puppet run. We can change the default cutoff time of unresponsiveness with puppet_enterprise::console services::no longer reporting cutoff argument parameter.
Have no Reports
There may be misconfiguration with the node’s copy of Puppet, or if Puppet has never come online, it may happen that the node has not submitted the Puppet report. We can look for seven days for expired or deactivated nodes on the status page. You can change this time by changing the node-ttl setting in PuppetDB, But be careful, as this change may impact the resources.
You might be wondering about the different status icons you have seen in Puppet. Let’s quickly understand this.
How Puppet Determines Node Run Status
A node’s run status determines the highest alert level among all the events during the run. Look at the table below to understand the events and their corresponding icons.
Now, a question arises in our mind about how the alert level is determined.
Puppet uses the hierarchical system with failure events having the highest alert level and no change events having the lowest alert level. We can determine the status of each node using this system.
Suppose a node with 50 resources receives no failures, 30 intentional changes, and no changes on the remaining 20 resources; then the node’s run status will be With Intentional Changes because it has the highest alert level among all the status.
Filtering Nodes on the Status Page
We have learned about the status page till now. We can filter the list of nodes that were displayed on the Status page. There are two types of filters for the same:
Filter by node run status
Filter by node fact
Your chosen filters are permanent. Even if you switch to other pages in the console, log out, run status, or fact filters that you specify on the Status page will remain to be applied to the table until they are altered or removed.
Let’s cover these filters in detail.
Filter by Node Run Status
We can filter the nodes by their run status. Summary of all the nodes is available on the Status page, and we can see the node status of the last Puppet run for each node. For example, We can filter nodes by selecting any run status, like With corrective changes.
Filter by Node Fact
We can also use the fact filter tool to create a highly specific list of nodes. We can also filter by facts required to fulfill an auditor’s request for information, like the count of nodes running a particular version of the software.
Following are the steps to filter:
First, click on the Filter by fact value option to apply the filter and select the fact among the available options. The fact field cannot be empty.
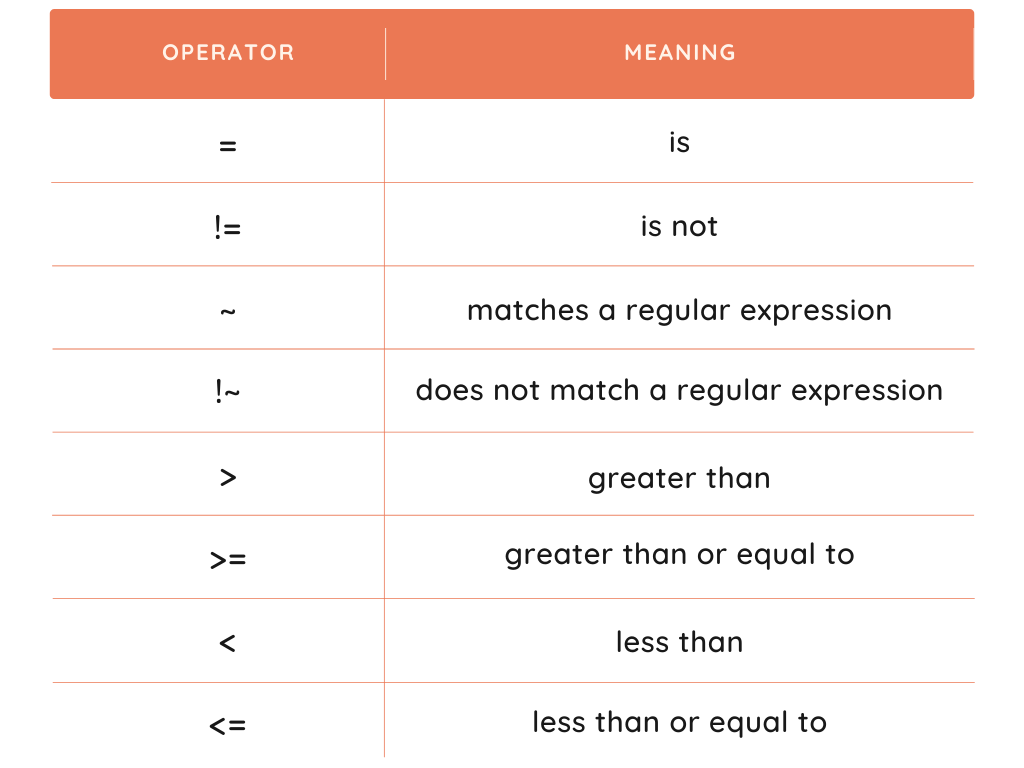
Select one operator. The description of all the operators is provided in the below table.
Enter a Value in the Value field. Make sure you use the correct case because strings are case-sensitive.
Click Add.
If you want to filter by more than one fact, you must repeat all these steps.
Viewing and Managing Packages
Packages are the collection of data of the Puppet nodes. We can view the packages and their details like version, name, number of instances, provider, etc., on the Packages page. We can use the package manager to view or update the packages.
To manage packages, we need first to enable package data collection, which is disabled by default. Now, instead of collecting package data for every node, we can only choose a subset and collect for them.
Enable Package Data Collection
Follow these steps to enable the Package data collection:
First of all, open the console and click Node groups. Now, we have two options -
Click on the PE Agent node group to collect package data for all the nodes.
If you don’t want to do this for all nodes, then you can enable it for the subset of your nodes, which can be done by creating a new classification group using Add group and selecting PE Agent as the group’s parent name.
The next step is to add the class using Add new class field, which is found in Classes. Select puppet_enterprise::profile::agent and click on Add class to add a new class.
Now we need to add the Parameter to the inventory, which can be done by going to puppet_enterprise::profile::agent class and setting the parameter to package_inventory_enabled and value to true. Save this by clicking on Add parameter.
Now run the Puppet to apply the changes we have made in the above steps. We need to run it twice to begin the package data collection. We can view them by clicking Packages.
Since we have learned how to view and enable package data collection, we must learn the steps to disable it.
Disable Package Data Collection
It is now easy to understand how we can disable this; we just have to set package_inventory_enabled to false as we have set it to true while enabling it.
These are the steps we need to follow if we want to disable the package data collection:
First, we must select the node group by clicking on Node groups.
Locate the package inventory enabled parameter in the puppet enterprise::profile::agent class on the Classes tab, then click Edit.
Now, we just need to change the value of package_inventory_enabled to false.
We have made the changes and now run the Puppet twice to apply changes and remove the package data from the node’s storage.
Value Report
In the previous section, we studied Packages and how we can enable or disable package data collection. Now we will see how we can view the Value Analytics.
Before moving on to that, we must be familiar with value analytics. It provides us insights into the time and money saved by Puppet Enterprise (PE) Automation. This information is provided by the type of change based on values we provide or intelligent defaults.
The information can be accessed using the Value report page or value API. However, the information provided might need to be more accurate. We can ensure accuracy by
Processing the Puppet normally runs because failed runs can’t be tracked using value analysis.
Querying the endpoints to gather information if we use the value API.
Infrastructure Reports
We have just learned the value reports. They are generated with each Puppet run. They provide information about the place of the run and issues encountered during the run. The report summary for each data can be found on the Reports page. We can use this to perform root cause analysis.
Refer to the following table to learn more about the states and the number of resources in each node.
Frequently Asked Questions
What is puppet, and how it works?
An open-source tool for managing and deploying software configuration is called Puppet.Puppet offers the capability to specify the software and configuration that a system needs and then, after initial setup, maintain a given state.
What are puppet reports?
We can customize the built-in report processors in Puppet. By default, Puppet creates a report after applying a catalog that contains details about the Run, including events, log messages, resource status, metrics, and metadata. Each host transmits a YAML dump of its report.
What is the most basic unit for modeling in puppets?
Modeling system setups begin with resources. A resource, such as a package or service, describes a specific aspect of a system. It goes to puppet and asks about adding it to the catalog.
What task can Puppet perform?
Puppet is an open-source Configuration Management tool most commonly used on Linux and Windows for configuring, deploying, and managing servers. External services can use performance and status metrics from Puppet Server to track the health and performance of a server over time.
Conclusion
So that's the end of this article, Basics of Reporting and Monitoring in Puppet. We have covered various node run status and how Puppet determines them. We have seen two methods of filtering nodes on the status page. We have also discussed packages and reports and how we can manage them.
Are you interested in reading/exploring more about Puppet? Don't worry; Coding Ninjas has you covered.


 6+ registered

