Do you think IIT Guwahati certified course can help you in your career?
Introduction
Power BI Desktop is a free application by Microsoft that can be installed on the local computer. It lets you connect to, transform, and visualize any data from different sources. It can also be used to create compelling reports to amplify business intelligence or to pull data from various sources and build data models, which they can share with their coworkers and organizations.
Power BI Desktop centralizes, simplifies, and streamlines what can otherwise be a scattered, disconnected, and arduous process of designing and creating business intelligence repositories and reports.
With Power BI Desktop, we can:
Connect to data from multiple data sources.
Analyze and shape the data using queries that build insightful and compelling data models.
Create visualizations and reports using modified data
Share your report files for others to leverage and build upon. You can share Power BI Desktop .pbix files like any other files or upload them on Power BI service.
To install the application, following link can be used: PowerBI
To get started with Power BI Desktop, the first step is to connect to data. There are many different data sources you can connect to from Power BI Desktop.
To connect to data:
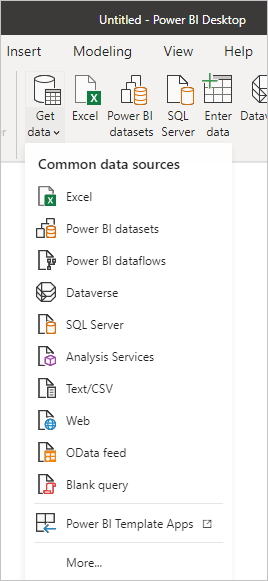
From the Home ribbon, select Get Data > More. The Get Data window appears, showing the many categories to which Power BI Desktop can connect.
When you select a data type, you're prompted for information, like URL and credentials in case of server/databases.This is necessary for Power BI Desktop to connect to the data source on your behalf. Local files, like excel or text files, can also be uploaded to the application for analysis.
After you connect to one or more data sources, you may want to transform the data as per the requirement.
There are three views available in Power BI Desktop. The views, shown in the order they appear on the left side of the canvas, are as follows:
Report: This view lets you create reports and visuals. Most of the creation time is spent here.
Data: This view lets you see other data used in the data model associated with your report like the tables, measures, etc, and transform the data for best use in the report's model.
Model: This view lets you understand and manage the relationships among tables in the data model.
Transforming and cleaning data on Power BI
After connecting the data, we can select Load to load the table, or Transform data to make changes in the table before loading.
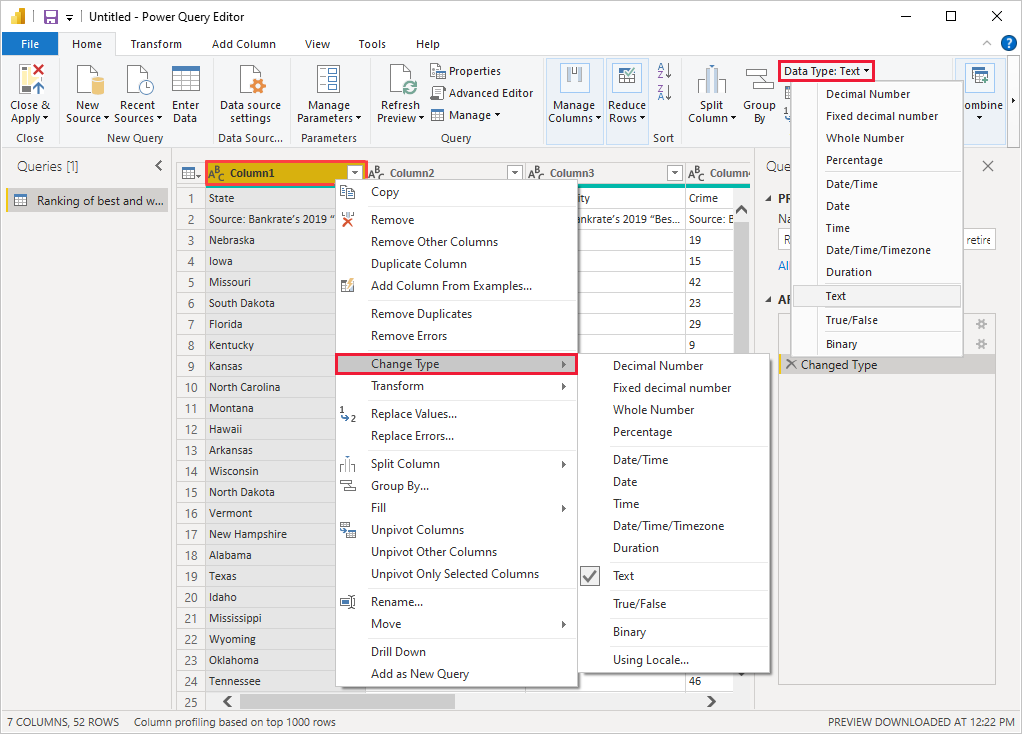
When you select Transform data, Power Query Editor launches, with a representative view of the table. Data can be cleaned and transformed using the built-in Power Query Editor. It helps to make changes to the data, such as changing a data type, removing columns, renaming or replacing values. Changes can be made in individual columns by clicking on the drop down menu in the column header. Hold down the Shift key to select several adjacent columns, or Ctrl to select non-adjacent columns and make changes.
Each step taken in transforming data is recorded by Power Query Editor. It captures these steps sequentially under Applied Steps in the Query Settings pane. Each time this query connects to the data source, those steps are carried out, so the data is always shaped the way you specify.
Combine Data: Data can also be combined from different sources. To import the data into Power Query Editor, select New Source > Source type from the New Query group on the Home tab of the ribbon.
Merge Data: When you have one or more columns you'd like to add to another query, you merge the queries. When you have additional rows of data you'd like to add to an existing query, you append the query.
Creating visuals
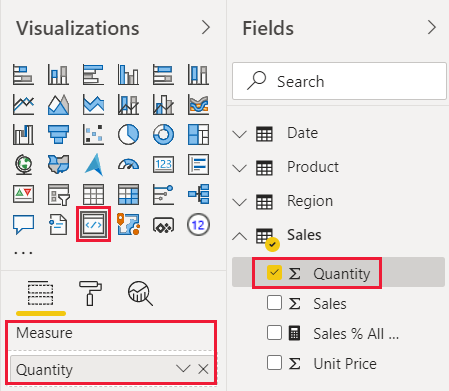
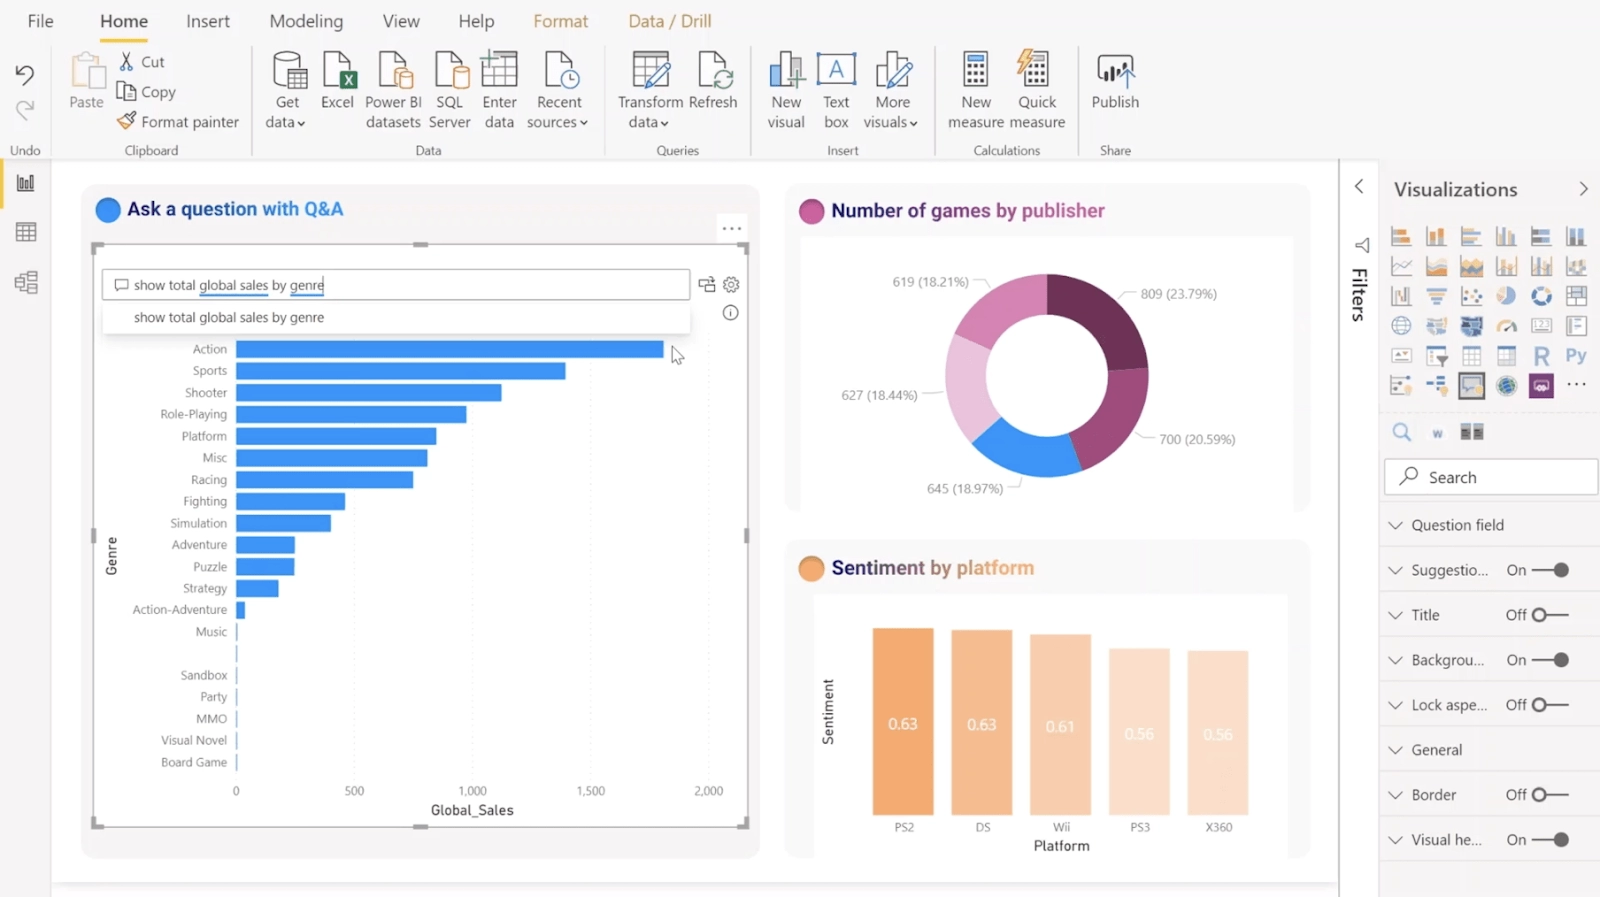
After we have a data model that is the new modified data, we can drag fields onto the report canvas to create visuals. A visual is a graphical representation of the data for better and easy understanding. There are many different types of visuals to choose from in Power BI Desktop. If no visual is selected on the canvas, a new visual is created based on your selection. These visuals can be created in PowerBI Desktop:
A collection of visuals, in a PowerBI Desktop file, is called a report. A report can have one or more pages, just like an Excel file can have one or more worksheets.
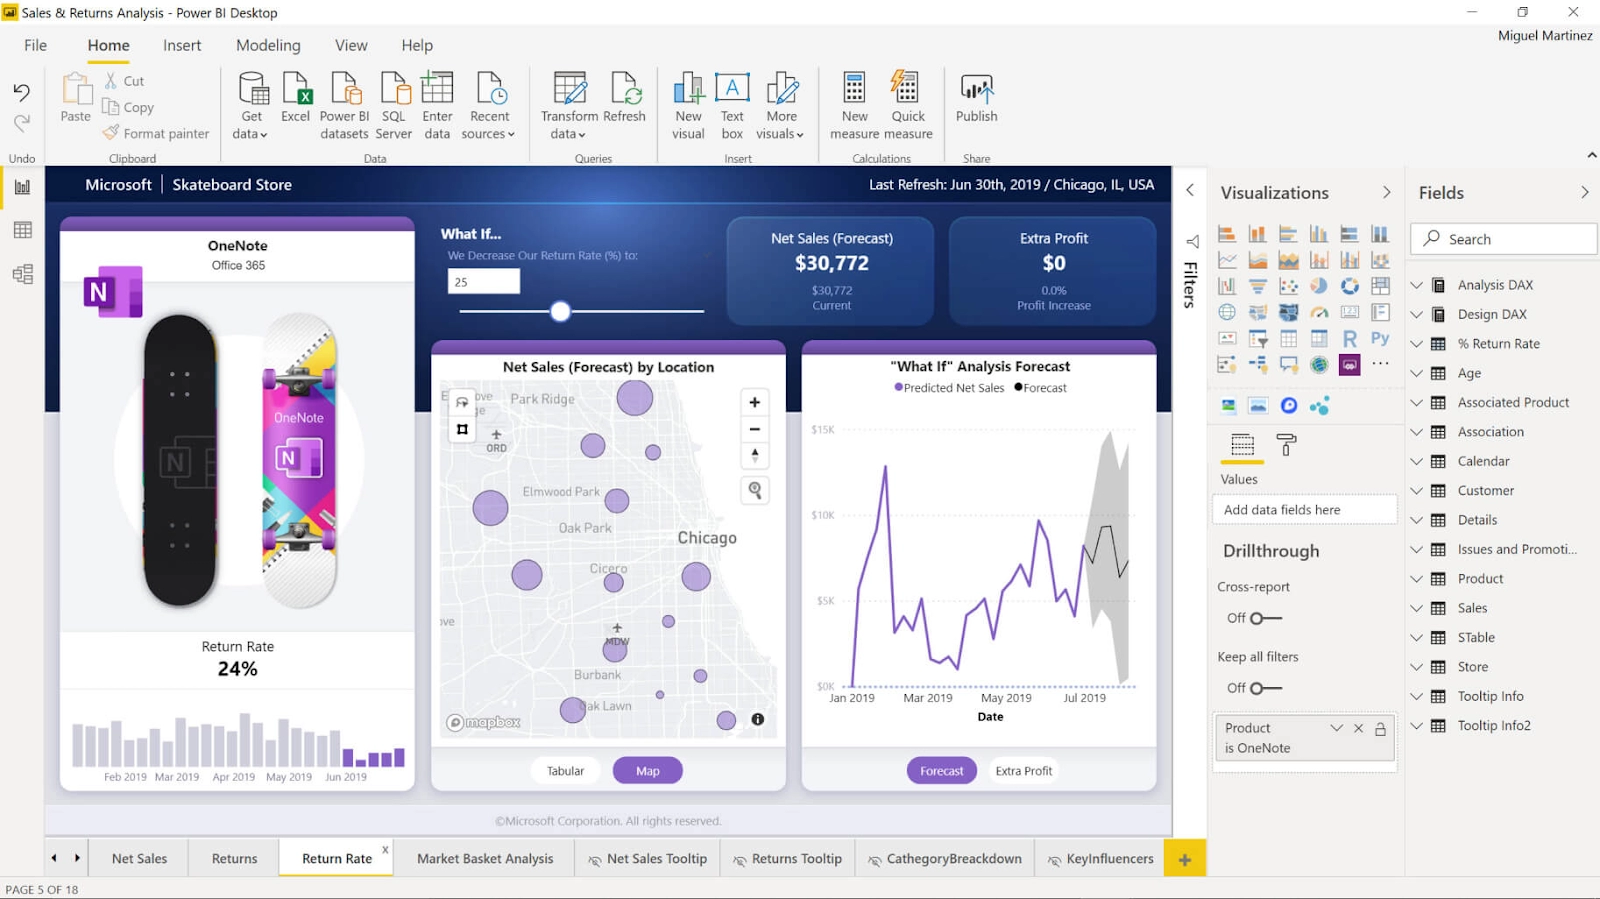
In PowerBI Desktop Report view, as shown below, we can build visualizations and reports.
Visualizations are created and arranged in the canvas area in the middle.
Filters can be added in visualizations from The Filters Pane.
We can add, change, or customize visualizations, and apply drill through in The Visualizations pane.
We can design the report and visualizations in The Format pane.
The Fields pane shows the available fields in your queries. We can drag these fields onto the canvas, the Filters pane, or the Visualizations pane to create or modify visualizations.
Sharing reports
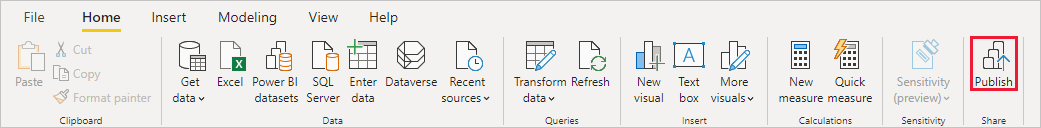
After a report is ready to share with others, we can publish the report to the Power BI service, and make it available to anyone who has a Power BI license. One must have a Power BI account to be able to publish or upload reports to Power BI service.
Power BI Desktop connects you to the Power BI service with the Power BI account.
Power BI prompts us to select where in the Power BI service we'd like to share the report, such as workspace, a team workspace, or some other location in the Power BI service.
Frequently Asked Questions
Can the users sign up to Power BI Desktop with a work email only?
Power BI doesn’t support email addresses provided by consumer email services or telecommunication providers.
Differentiate between PBIX and PBIT file extensions
The PBIT file keeps the report structure and contains ‘DataModelSchema File’ instead of ‘DataModel File’ while the PBIX file stores all imported data from data sources and the report structure.
What are the three components of the Power BI Desktop?
The three components of Power BI Desktop are Power Query, Power Pivot and Power View or Power Map.
Conclusion
In this blog, we discussed Power BI Desktop. We also discussed working and reporting in the application and its various concepts.


 9+ registered

