Table of contents
1.
Introduction to Power BI Service
2.
Creating Reports in Power BI Service
3.
Sharing Reports in Power BI Service
4.
Concepts of Power BI Service for designers 
5.
Tutorial to get started with the Power BI service
5.1.
Sign up for the Power BI service
5.2.
Step 1: Get the data from resources
5.3.
Step 2: Create a chart in a report
5.4.
Step 3: Explore with Q&A
5.5.
Step 4: Reposition tiles
6.
Frequently Asked Questions
6.1.
How can we create quick reports in the Power BI service?
6.2.
What are the latest features included in the Power BI service?
6.3.
What is the canvas area in the dashboard of the Power BI service?
7.
Conclusion
Last Updated: Mar 27, 2024

Overview of Power BI Service

Career growth poll
Do you think IIT Guwahati certified course can help you in your career?

Introduction to Power BI Service

Power BI Service is offered by Microsoft, a collection of software services, relevant applications and connectors that work together to help the users. It offers these collective services to help in creating, sharing, and consuming business insights, which helps its users and their business effectively. The Power BI Service comes under the SaaS, Software as a Service part of Power BI. In this service, the created dashboards help in maintaining the data and performing meaningful analysis with their help. Dashboards consist of different components such as tiles for viewing reports and are connected to datasets to integrate all the important data in one place. 

Creating Reports in Power BI Service

Generally, reports are created in the Power BI Desktop and then published to the Power BI Service, however, we can also make reports and dashboards in Power BI using the online data. Power BI service has applications to support their creation.

A Power BI report offers a multi-perspective view into a dataset using visualizations and insights from that dataset. Advantages of using reports are that they are highly interactive and customizable as they can be of multiple pages, and the users get relevant information which is continuously updated.

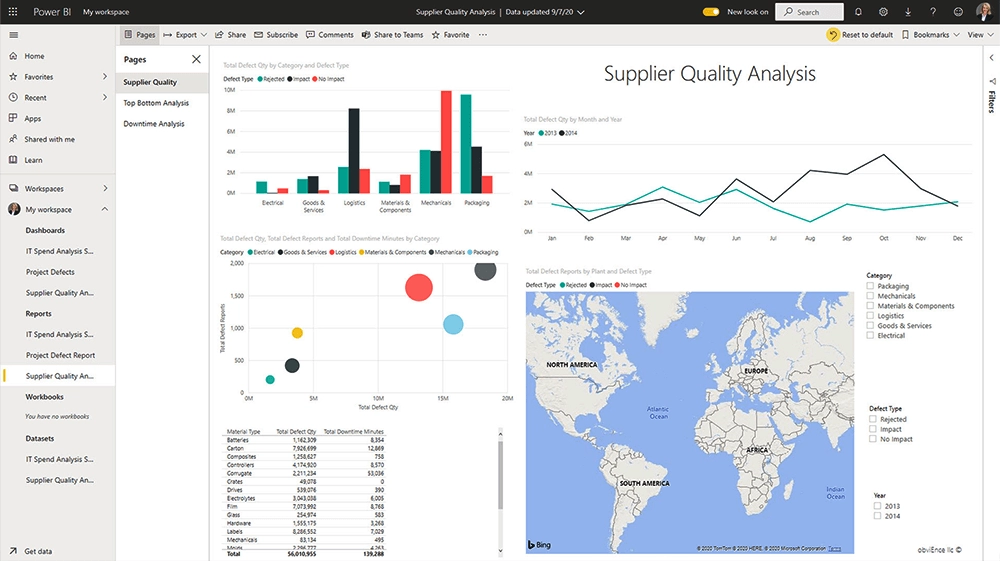
An example of a report created using Power BI Service is displayed below.

Source: Link

Sharing Reports in Power BI Service

After the completion of a report, we can make use of the Power BI service to publish the report and make it available for everyone who has a Power BI license. In order to access the Power BI service and publish or upload the reports, we require a Power BI account. 

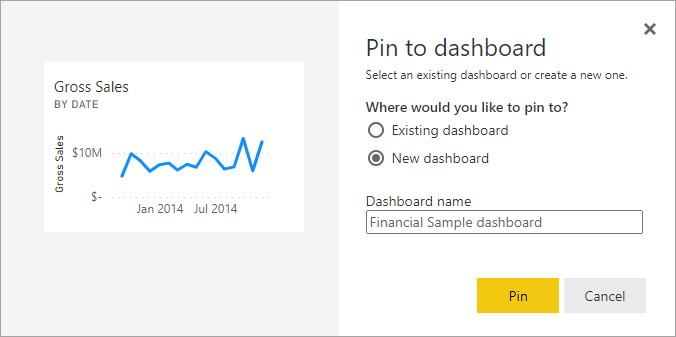
The created reports and dashboards can be shared with end users and mobile devices can be used to view and interact with them. Users can also collaborate on workspaces to build reports and dashboards. 

Concepts of Power BI Service for designers 

Designers can make use of the Power BI service to produce reports and dashboards using its features and services. The workflow of a designer starts by creating reports in the Power BI Desktop and publishing them to the Power BI service, where they can be modified. We can also create dashboards based on the reports we have created in the Power BI service. 

The major components of the Power BI services are: dashboards, reports, workbooks, datasets and dataflows. They are organized into workspaces and are created in capacities. 

Capacities are a set of resources used for hosting and delivering Power BI content, whereas workspaces are created on these capacities. Workspaces are containers for all the elements in the Power BI service. Both capacities and workspaces can be shared or reserved and personalized for use. 

Tutorial to get started with the Power BI service

In this section, we will discuss the steps needed to be performed for using some of the features of the Power BI service:

Sign up for the Power BI service

The users need a Power BI Pro or Premium User License for creating content in Power BI. To get a free license we need to complete the wizard, then open the Power BI service, select the Me icon and choose the Buy Pro now option or Try paid features for free.

Source: Link

Step 1: Get the data from resources

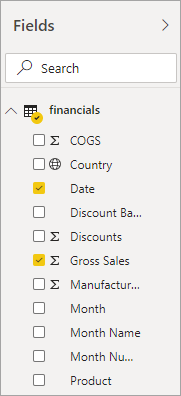
We need to transform, shape, and model data before starting to design a report. The data can be collected from multiple sources. Let us consider the example of taking the data from an Excel file.

  • Open the Power BI service in the browser.
Screenshot of Create new content > Files.

Source: Link

  • Select My Workspace option in the navigation pane.
  • In My Workspace, go to New and select Upload a file.
  • Under the Create new content panel, select Files>Local File and then select the location from where the excel file needs to be selected.
  • Browse the file and choose Open.
  • Here, we choose Import to add the Excel file as a dataset and Upload the file.

Source: Link

  • When the dataset is ready, select More options(...) and then select Create report to open the report editor.
Screenshot of All content > Create report.

Source: Link

  • We get a blank report canvas and can start editing the report.

Source: Link

Step 2: Create a chart in a report

Now, follow the given steps to create a chart.

  • In the report editor, select Fields pane followed by Gross Sales and then Date field.

Source: Link

  • Select the type of chart wanted from the Visualizations pane.

Source: Link

  • Save the report after making it according to the requirement.
  • Select New dashboard and name it as you want.

Source: Link

  • Select Go to dashboard to view the dashboard you created,

Source: Link

Step 3: Explore with Q&A

In the dashboard, select the Q&A box to Ask a question about your data. Use this feature according to the query.

Source: Link

Step 4: Reposition tiles

We can rearrange the tiles to enhance the usability of the dashboard. Below is an example of the rearrangement of tiles in the dashboard.

Source: Link

Frequently Asked Questions

How can we create quick reports in the Power BI service?

We can create quick reports by pasting data straight into Power BI on the web, and the service automatically generates visuals for us.

What are the latest features included in the Power BI service?

The latest features include Power BI data storytelling, announcing the data hub and Power BI metrics updates.

What is the canvas area in the dashboard of the Power BI service?

The canvas area displays visualization tiles in the Power BI service which can be used to make the dashboard using visuals.

Conclusion

In this blog, we discussed the Power BI service along with its related topics.

Refer to our guided paths on Coding Ninjas Studio to upskill yourself in Data Structures and AlgorithmsCompetitive ProgrammingJavaScriptSystem Design, and many more! If you want to test your competency in coding, you may check out the mock test series and participate in the contests hosted on Coding Ninjas Studio! But if you have just started your learning process and are looking for questions asked by tech giants like Amazon, Microsoft, Uber, etc; you must have a look at the problemsinterview experiences, and interview bundle for placement preparations.

Nevertheless, you may consider our paid courses to give your career an edge over others!

Do upvote our blogs if you find them helpful and engaging!

Happy Learning!

Live masterclass