


Introduction
Power BI is an online, cloud-based service for creating light reports and analyzing data. It is easy to collaborate on Power BI as it is an online service platform.
To read the most commonly asked interview questions on Power BI visit, Power BI interview questions.
This article will discuss some basic concepts for designers in the Power BI service.
Power BI Service Concepts
Capacities are the one that contains the workspaces on which all the main five building blocks of Power BI are organized.
The five main blocks of Power BI are:
- Workbooks
- Datasets
- Dataflows
- Dashboards
- Reports

This article will discuss capacities, workspaces, and the five blocks of Power BI service.
Capacities
The most abstract part of Power BI is Capabilities, containing the set resources. The resources can be storage, memory, and processor. It is used to host and deliver reports. It becomes handy when we want multiple users to collaborate on a single project. It can be both reserved or shared.
If capacities are reserved, they cannot be used for collaboration as it is reserved for a single Microsoft user. However, a reserved capacity requires a subscription. Capacities are, by default, shared. There are certain limitations on maximum model size and maximum daily refresh frequency.
Workspaces
The next thing you need to understand after capacities are workspaces. Workspaces are where the dataflows, datasets, reports, workbooks, and dashboards are organized. They are created on capacities.

Following are the two workspaces present in Power BI:
-
My Workspace: It is a personal workspace for any Microsoft user to create their content. It can be used for personal uses. The access is limited to the owner of the Workspace. The reports and dashboards created on My Workspace can also be shared with others but cannot be used for collaboration. If you want others to collaborate, then you have to use Workspace.
-
Workspace: The primary purpose of using a Workspace over My Workspace is collaboration. With Workspace, you can collaborate on reports and dashboards. It is essential that each workspace member have a Power BI Pro or Premium Per User license.
Workspaces provide an integrated place for creating, publishing, and managing apps in Power BI. It is like a container where you can store all the information about your application and assembly each part to create a complete application.
Next, we will discuss the contents of Workspaces, which are the datasets, dataflows, reports, workbooks, and dashboards.
Dataflows
Managing large amounts of data becomes difficult in complex and large projects. Dataflows allow us to organize data in a single place that may be collected from different sources. Dataflows consist of various tables containing data. Dataflows represent data collected from on-premise as well as from the cloud.
They can only be used with Workspaces and not with My Workspace. It is stored in CDM(common data model) in Azure Data Lake Storage Gen2. It is optional to use dataflows.
Datasets
A dataset is a collection of data. The data may be imported to or connected to the Power BI application. Datasets help in bringing all sorts of data to one place.

Datasets are related to workspaces, and you can connect a single dataset to one or more workspaces. All the datasets associated with a workspace are listed together under the datasets tab. Datasets are created in both My Workspace and Workspaces.
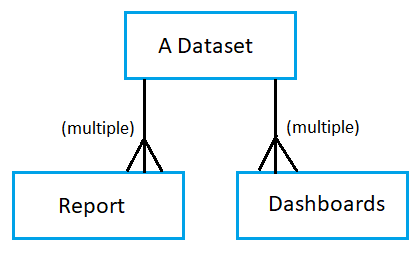
A single dataset can be
- Used multiple times in a single workspace.
- Used in multiple workspaces
- Used for creating multiple reports
- Used for creating visualizations that display on different dashboards.
The data in the datasets can be used to create reports and dashboards. To get the data in a dataset, you can either import the data from any source(on-premise or cloud) or connect to any source.
Datasets added by one workspace member are accessible to all workspace members with the admin, member, or contributor roles.
On datasets, you can perform a variety of operations. You can rename, refresh, explore, and remove any datasets at any time from any workspace. Exploring a dataset means accessing or inspecting it; you can view it by selecting it from the datasets tab.
Reports
A report is a set of visualizations created using the data from the datasets. These reports can be shared with others to spread the understanding of a dataset. It is important to note that all the visualizations or visuals present in a report must come from a single dataset. However, a single dataset can be used for creating multiple reports.
Power BI allows you to create reports from scratch by importing them from dashboards shared by colleagues. We can also create reports by connecting to datasets from Excel, databases, Power BI Desktop, and SaaS applications.
A report can be viewed in two modes:
- Reading mode
-
Editing mode
If you open a report, then it opens in Reading mode. If you have editing permissions, you can only view a report in Editing mode. If your report is in a workspace, then any member with a contributor, admin, or member role can edit the report. By default, reports are opened in Reading mode. To open a report in Editing mode, you have to select the Edit report option present in the upper left corner.
All the reports in a workspace can be found under the content tab. You can select any report from there and open it.
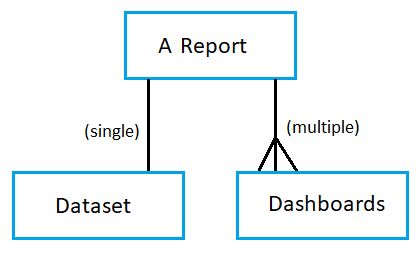
A single report is
- Present only in one Workspace
- It is created using a single dataset
- Can be associated with multiple dashboards
Dashboards
A dashboard is like a canvas that contains visualizations. It is used to impart insights from the datasets with the help of visualizations. It contains one or more tiles and widgets. Each report tile pinned to the dashboard displays a single visualization created from a dataset. Multiple pages can also be integrated into a single tile.
Dashboards provide all the information regarding one or more datasets and one or more reports in one place, making it easy to make decisions. It ensures that all the colleagues are on the same page with the same information.
All the dashboards associated with a workspace can be found under the content tab. You can select any dashboard from there and open it.
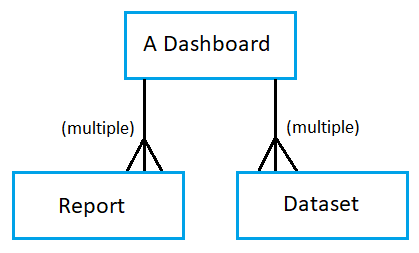
A single dashboard is:
- Associated with a single workspace
- Can display visuals from different reports
- Can display visuals from different datasets
Workbooks
Workbooks in Power BI are the same as datasets. When using Get data with Excel files, you can Import or Connect to the file. When you select Connect, your workbook will show up in Power BI in the same way that it would in Excel Online. However, in Excel Online, you will have some great features that allow you to pin elements from your worksheets directly to your dashboards.
You cannot edit a workbook in Power BI. If you select the edit option for a workbook, it will open in excel online. Another way to edit your workbook is by using Excel on your computer.


 9+ registered

