Do you think IIT Guwahati certified course can help you in your career?
Introduction
Decision Tree Regression is a supervised machine learning algorithm used for predicting continuous values. It works by splitting the dataset into smaller subsets based on decision rules, forming a tree-like structure. Each leaf node represents a predicted value. This technique is useful for capturing non-linear relationships in data.
In this article, you will learn about Decision Tree Regression, its working mechanism, advantages, and implementation.
Decision Tree on a 1D Regression Task
A Decision Tree can be used for regression tasks involving one-dimensional data. It divides the dataset into different segments, assigning a constant value to each segment. This makes it an effective choice for modeling complex data relationships. Let’s go step by step through the process of implementing Decision Tree Regression.
Working of Decision Tree Regression
Data Splitting: The dataset is recursively divided into subsets based on conditions applied to feature values.
Leaf Nodes: The final segments of the tree contain predicted values.
Prediction: For any new input, the algorithm follows the path in the tree to a leaf node and returns its value.
Overfitting Prevention: Depth constraints and pruning techniques help maintain model generalization.
This predicts the output for test values within the feature range.
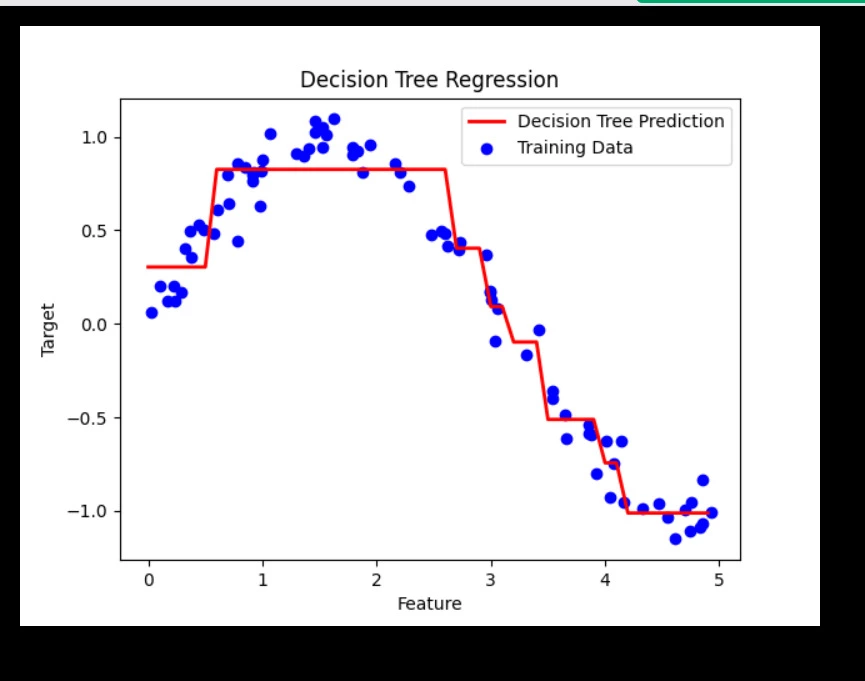
Plot the Results
Let’s visualize the regression model’s predictions:
plt.scatter(X, y, color="blue", label="Training Data")
plt.plot(X_test, y_pred, color="red", linewidth=2, label="Decision Tree Prediction")
plt.xlabel("Feature")
plt.ylabel("Target")
plt.title("Decision Tree Regression")
plt.legend()
plt.show()
Output
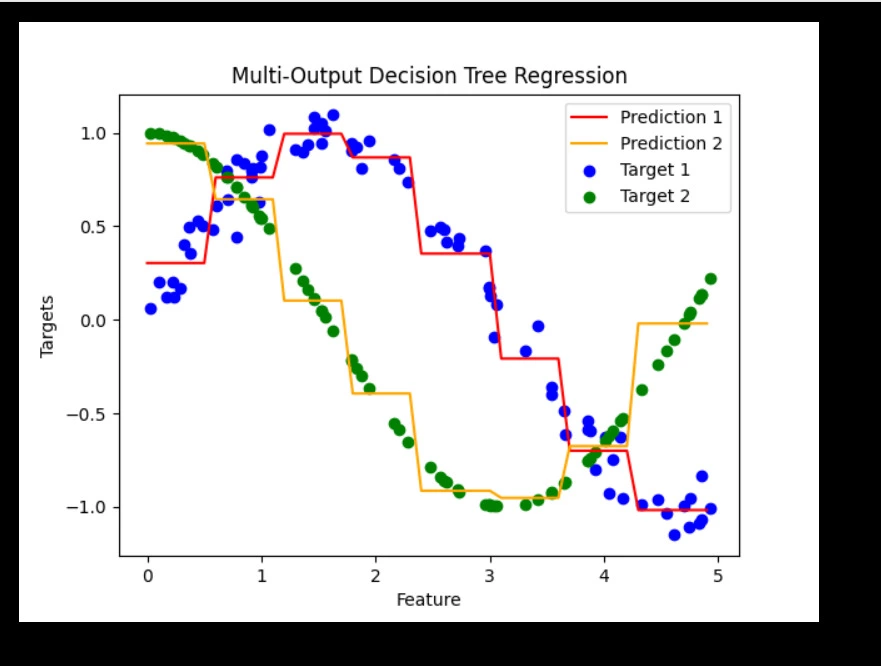
Decision Tree Regression with Multi-Output Targets
Decision Tree Regression can handle multiple target variables simultaneously. Below is an example where we predict multiple outputs:
# Generate multi-output data
Y = np.vstack((y, np.cos(X).ravel())).T

# Train a Decision Tree model for multi-output regression
dt_multi_output = DecisionTreeRegressor(max_depth=3)
dt_multi_output.fit(X, Y)

# Predict on test data
y_multi_pred = dt_multi_output.predict(X_test)

# Plot predictions
plt.scatter(X, Y[:, 0], color="blue", label="Target 1")
plt.scatter(X, Y[:, 1], color="green", label="Target 2")
plt.plot(X_test, y_multi_pred[:, 0], color="red", label="Prediction 1")
plt.plot(X_test, y_multi_pred[:, 1], color="orange", label="Prediction 2")
plt.xlabel("Feature")
plt.ylabel("Targets")
plt.title("Multi-Output Decision Tree Regression")
plt.legend()
plt.show()
Output
Frequently Asked Questions
What is Decision Tree Regression used for?
Decision Tree Regression is used for predicting continuous values by learning decision rules from training data.
How does Decision Tree Regression handle overfitting?
Overfitting can be controlled using techniques like pruning, setting maximum depth, and limiting the number of samples per leaf.
Can Decision Tree Regression handle multi-output targets?
Yes, it can predict multiple output values for a given input by using a multi-output DecisionTreeRegressor.
Conclusion
In this article, we discussed Decision Tree Regression , a machine learning algorithm used for predicting continuous values by splitting data into smaller subsets. It works by creating a tree-like model where decisions are made based on feature conditions. Decision Tree Regression is useful for handling non-linear relationships and provides an interpretable way to make predictions. Understanding this algorithm helps in solving real-world regression problems effectively.


 6+ registered

