Do you think IIT Guwahati certified course can help you in your career?
Introduction
Ever wondered how stock trading apps recommend investments based on your goals or how YouTube suggests videos tailored to your interests? Both use machine learning but follow different approaches.
Stock trading apps use supervised learning, where past data helps predict future outcomes based on predefined target variables, like user goals. In contrast, YouTube’s recommendation system relies on unsupervised learning, identifying hidden patterns in user behavior without specific objectives.
In supervised learning, labeled data trains models for prediction, ensuring accurate outputs. Unsupervised learning, however, explores unstructured data to uncover insights and patterns. Understanding these differences is key to leveraging machine learning effectively.
What is Supervised Learning?
Supervised tasks, as discussed earlier, have desired outputs. Supervised learning models typically have Classification or Regression outputs. Classification models map input data to discrete output labels.
For example, we are supposed to predict whether a customer would continue their business with a bank in the next fiscal year. That makes it our dependent or target variable. So we can predict the same, using past data, by studying the other independent variables like Age, Gender, Educational qualification, number of dependents, etc. In this case, our output would be either ‘Yes’ or ‘No’.
Regression tasks have continuous outputs. That means the output values aren’t confined within a set of all possible values.
For example, We are supposed to predict house prices in Delhi in a certain month using past data. The prices are volatile and could take any value. This is a regression model.
Types of Supervised Learning
Supervised Learning is a branch of machine learning where algorithms learn from labeled data to make predictions or decisions. It is categorized into two main types: Regression and Classification.
Regression
Regression is a supervised learning technique used to predict continuous values. It models the relationship between a dependent variable and one or more independent variables. This type of learning is crucial for tasks such as predicting stock prices, house prices, or any numeric value that can vary over a continuous range.
Common Regression Algorithms
Linear Regression: It models the relationship between dependent and independent variables by fitting a linear equation to the observed data. It's widely used due to its simplicity and interpretability.
Polynomial Regression: This extends linear regression by fitting a polynomial equation to the data. It can capture more complex relationships but may be prone to overfitting.
Lasso Regression: Lasso (Least Absolute Shrinkage and Selection Operator) regression adds a penalty term to the linear regression equation to prevent overfitting by reducing the coefficient values.
Ridge Regression: Similar to Lasso, Ridge regression adds a penalty term, but it uses the squared magnitude of the coefficients (L2 regularization), making it effective when there are many correlated variables.
Classification
Classification is another type of supervised learning used to predict categorical outcomes or class labels. It involves learning from labeled data to assign new observations into categories. Applications include spam detection, disease diagnosis, and image classification.
Common Classification Algorithms
Logistic Regression: Despite its name, logistic regression is used for binary classification tasks. It predicts the probability of an instance belonging to a particular class using a logistic function.
Support Vector Machines (SVMs): SVMs find a hyperplane in a high-dimensional space that best separates classes. They are effective in high-dimensional spaces and cases where the margin of separation is important.
Decision Trees: These hierarchical structures partition the data into subsets based on features, aiming to classify instances by following the tree nodes corresponding to different attribute values.
Random Forests: A collection of decision trees where each tree gives a class prediction, and the final prediction is the mode of the individual tree predictions. It reduces overfitting and improves accuracy.
Naïve Bayes: Based on Bayes' theorem, it assumes independence among predictors and calculates the probability of each class given the input data. Naïve Bayes is simple yet effective for text classification and spam filtering.
These algorithms form the backbone of supervised learning, each suited to different types of data and prediction tasks, offering diverse approaches to handling both regression and classification challenges.
Applications of Supervised Learning
Spam Filtering: Supervised learning is used in email systems to classify messages as spam or legitimate. Example: Gmail and Outlook use spam detection algorithms trained on labeled emails to filter out unwanted messages.
Image Classification: Machine learning models categorize images into predefined classes, such as identifying animals, objects, or handwritten digits. Example: Facial recognition in smartphones, where AI detects and unlocks based on the owner’s face.
Medical Diagnosis: AI helps diagnose diseases by analyzing patient data, such as symptoms, medical history, and test results. Example: Machine learning models assist in detecting cancer from X-rays and MRI scans with high accuracy.
Fraud Detection: Financial institutions use supervised learning to identify fraudulent transactions by recognizing unusual spending patterns. Example: Credit card companies flag suspicious transactions based on past fraudulent activity.
Natural Language Processing (NLP): NLP applications include sentiment analysis, text summarization, and language translation. Example: Chatbots like ChatGPT analyze and generate human-like responses, enhancing customer support.
Advantages of Supervised Learning
Learns from labeled examples: The model is trained on well-labeled data, improving prediction accuracy.
Improves over time: As more data is provided, the model continuously enhances its performance.
Versatile applications: It is widely used in finance, healthcare, security, and entertainment.
Handles both classification and regression tasks: It can predict both categorical (classification) and continuous (regression) outcomes efficiently.
Disadvantages of Supervised Learning
Requires large, well-labeled datasets: Collecting and labeling data is costly and time-consuming.
Struggles with complex, unstructured problems: It may not perform well in abstract reasoning or unstructured environments like creative tasks.
High computational power and long training times: Training complex models demands significant resources, making real-time processing difficult.
Algorithms
Linear Regression
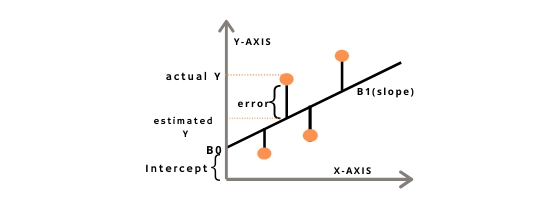
The most basic yet very popular supervised learning algorithm. As the name suggests, this algorithm is used for regression tasks. The data points are plotted on an X-Y plane, where Y is the dependent or target variable and X is the independent or input variable. Linear regression finds a linear relationship between these values. It is given by the formula:-
Y = a1.X + a0
Where Y = dependent variable
X = independent variable
a1 = Linear regression coefficient
a0 = Y intercept
The algorithm finds the best fit line given the (x,y) coordinates. The best fit line is the one where the error between the predicted value and the actual value is minimum. Basically, we try to find values for a0 and a1 for which the error is minimised. This is done with the help of a cost function. The cost function is given by the formula:-
Mean Squared Error (MSE) = 1/N ∑(actual-forecast)2
N = total number of values
actual = actual value (as given in (x,y) coordinates)
forecast = predicted value (as predicted by the function a1.X + a0 )
The cost function checks for which values of ao and a1 is the function most accurate.
For a single independent variable, it’s called single linear regression. For multiple independent variables, it’s called multiple linear regression.
Logistic Regression
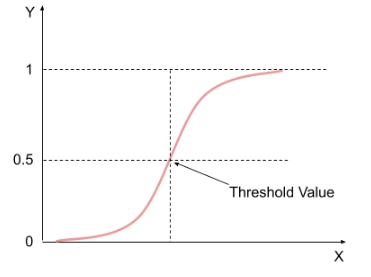
It might sound counter-intuitive to think Logistic regression is actually a classification algorithm i.e it is employed when the target variable is categorical. It gives the probabilistic values, i.e., its value lies between 0 and 1. This is done with a logistic function. The function predicts the probability of an outcome. We decide a threshold value above which the outcome would be favourable and below which the outcome would be unfavorable.
Suppose an employer needs to check if a certain employee deserves a raise. The logistic function would generate a value between 0 and 1. We would decide a threshold value, say 0.5, above which the employee deserves a raise. And below which they don’t. Suppose the outcome of the algorithm is 0.7 (>0.5), the employee would get a raise. Now since there can be only two possible outcomes (raise or no raise), that makes this problem a classification problem.
Since all the values lie between 0 and 1(probabilistic function), it forms an S-like Curve called the sigmoid function.
It is given by: log[y/(1-y)] = b0 + b1x1 + b2x2 + b3x3 + ……. + bnxn
There are various types of logistic regression such as binomial( 2 dependent variables), multinomial(3 or more unordered dependent variables), ordinal(3 or more ordered dependent variables).
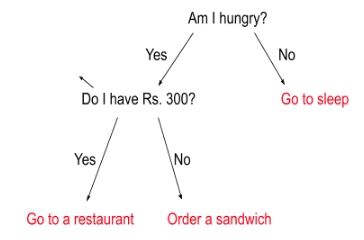
Decision Trees
A supervised learning algorithm that is mainly used for classification problems but can be used for regression tasks as well.
Decision trees are tree-like classifiers where the internal nodes are decision nodes and the leaf nodes are outcome nodes.
In the above example, all the internal nodes are decision-makers while end or leaf nodes are outcomes. We can see how a decision tree comes to a conclusion.
The best thing about decision trees is that they are very intuitive owing to their decision-making process via a tree-like structure. But it needs to be carefully implemented since the algorithm is vulnerable to overfitting or underfitting. An optimal tree depth needs to be chosen.
There are various other supervised learning algorithms such as Random forest, K nearest neighbors, etc.
Unsupervised Learning
Unsupervised tasks, as discussed earlier, don’t have any expected results. That is, we don’t have a certain output for a given input. The aim is to infer as much relevant information as possible by studying the underlying patterns. Unsupervised Learning Models are trained using unlabelled data.
For example, the Netflix recommendation engine studies user patterns to learn the kind of content a user prefers. And hence concludes which shows to recommend to a certain consumer. There isn’t any specific output to this unlike in supervised learning tasks where we expected the model to return a result by studying past data like house prices in Delhi in the month of January.
Supervised learning algorithms can’t be employed directly for unsupervised tasks. There are three majors tasks for which unsupervised learning is employed-
Dimensionality Reduction - Principal Component Analysis, Singular Value Decomposition, Autoencoders.
Clustering
Clustering is an unsupervised learning technique used to group similar data points based on shared characteristics. It helps in discovering patterns within data without predefined labels. Clustering is widely used in customer segmentation, anomaly detection, and recommendation systems.
Major Clustering Algorithms
K-Means Clustering: Divides data into k clusters by minimizing intra-cluster variance. It is efficient for large datasets but requires specifying the number of clusters in advance.
Hierarchical Clustering: Builds a tree-like structure of clusters using either an agglomerative (bottom-up) or divisive (top-down) approach. It is useful for datasets with hierarchical relationships.
Density-Based Spatial Clustering (DBSCAN): Groups data points based on density, making it effective for identifying clusters of varying shapes and detecting noise.
Gaussian Mixture Models (GMMs): Uses probabilistic distribution to model clusters, allowing for overlapping cluster assignments rather than hard boundaries.
Association Rule Learning
Association rule learning identifies relationships between different items in a dataset, helping businesses understand purchasing behaviors and hidden patterns. It is commonly used in market basket analysis, recommendation systems, and fraud detection.
Key Algorithms
Apriori Algorithm: Generates frequent itemsets and extracts association rules using support and confidence measures. Widely used in retail for finding co-purchased products.
Eclat Algorithm: Uses a depth-first search approach to generate frequent itemsets efficiently. Suitable for datasets with a large number of transactions.
FP-Growth Algorithm: Uses a compact data structure called an FP-tree to mine frequent itemsets without candidate generation, making it faster than Apriori.
Applications of Unsupervised Learning
Anomaly Detection: Used in fraud detection, cybersecurity, and system failure prediction by identifying unusual patterns in data. Example: Detecting fraudulent credit card transactions.
Scientific Discovery: Helps analyze genetic sequences, climate patterns, and medical data to uncover hidden insights. Example: Identifying gene mutations associated with diseases.
Recommendation Systems: Personalizes content suggestions based on user behavior. Example: Netflix suggesting movies based on viewing history.
Customer Segmentation: Groups customers based on purchasing habits for targeted marketing campaigns. Example: E-commerce platforms using clustering for personalized offers.
Advantages of Unsupervised Learning
No need for labeled data: Reduces time and cost in data preparation.
Handles large datasets effectively: Can process massive amounts of unstructured data.
Uncovers hidden patterns: Identifies unknown relationships within data.
Useful for trend detection: Helps businesses make data-driven decisions.
Disadvantages of Unsupervised Learning
Difficult to assess accuracy: No predefined labels make validation challenging.
Lower precision for complex tasks: Less effective without prior guidance.
Requires manual interpretation: Clusters and patterns need human analysis.
Sensitive to noise and outliers: Data inconsistencies can impact results.
Refer to this blog for a more in-depth understanding of the above-mentioned techniques - Unsupervised Learning.
When to Use Supervised vs Unsupervised Learning
Choosing between supervised and unsupervised learning depends on the type of data available, the problem being solved, and the specific goals of the model. The key factors include whether the data is labeled or unlabeled and whether the goal is to predict an outcome or uncover hidden patterns.
Choosing the Right Approach Based on Data
When deciding between supervised and unsupervised learning, the most important factor is whether the data is labeled or not.
Supervised Learning: This approach is ideal when you have labeled data and a clear outcome to predict. Supervised learning is used for tasks like classification or regression. It requires a training dataset with input-output pairs. For example, in image recognition, the model learns from labeled images to classify new images. In predictive maintenance, historical data about machine failures is used to predict future breakdowns. Similarly, spam email classification uses labeled emails to train the model to classify incoming emails as spam or not.
Unsupervised Learning: When labeled data is unavailable, unsupervised learning is the go-to method. It aims to find hidden patterns, clusters, or anomalies in the data. This is useful when the goal is to group data or identify outliers. For example, in customer segmentation, unsupervised learning groups customers based on purchasing behavior. In anomaly detection, it helps identify unusual patterns, such as fraud detection in financial transactions or abnormal network behavior.
Real-World Examples for Each Approach
Supervised Learning Example: A real-world example of supervised learning is predicting house prices using historical data on house features like size, location, and age. This is a regression problem where the goal is to predict a continuous output. Another example is classifying emails as spam or not spam, which is a classification problem.
Unsupervised Learning Example: In customer segmentation, unsupervised learning can group consumers into clusters based on their buying habits, allowing companies to target specific customer types with personalized marketing. Similarly, anomaly detection in network traffic can identify unusual behavior, such as a potential cyberattack or security breach.
The choice between supervised and unsupervised learning depends on whether the data is labeled or not, and on the specific problem. Selecting the right approach helps ensure that models are both accurate and efficient, enabling better predictions or insights from the data.
Difference between Supervised vs. Unsupervised Machine Learning
Supervised Learning
Unsupervised Learning
Trained using labelled data.
Trained using unlabelled data.
Expected outputs for a certain input.
There are no expected outputs.
Predicts the output for a given input.
Finds underlying patterns within the input data.
Can be classified into Regression or Classification problems
Can be classified into Clustering, Association, or Dimensionality reduction problems.
Results can be validated since we have expected output for every given input.
Results cannot be validated and often need human intervention to deduce results. Therefore results can sometimes be vague
Input data needs a lot of preprocessing before it can be used to train the model.
Input data generally doesn’t require as much preprocessing.
Frequently Asked Questions
What is the primary difference between supervised and unsupervised learning?
Supervised and unsupervised learning are different in their objectives. Supervised learning has well-defined objectives. In supervised learning, models are trained with input data and corresponding output data. Unsupervised learning models are supposed to find underlying patterns within the dataset. Unsupervised learning models are trained with an unlabelled dataset.
Mention some of the algorithms of supervised and unsupervised learning.
Supervised Learning A. Linear regression B. Logistic regression C. Decision trees D. Random Fores E. Support Vector Machines(SVM)
Unsupervised Learning A. K-means B. Apriori algorithm
Mention some real-life examples of supervised and unsupervised learning.
Supervised Learning - Stock trading apps suggesting stocks based on user goals. Unsupervised learning - Spotify recommends songs based on recent user activity.
Conclusion
Being able to finely differentiate between supervised and unsupervised learning is fundamental for data scientists. Supervised and Unsupervised learning are equally important today and data scientists are expected to have an in-depth knowledge of both kinds of tasks. It’s important to know which algorithm needs to be employed for a given problem.


 9+ registered

