Do you think IIT Guwahati certified course can help you in your career?
Introduction
A Structured Analysis and Structured Design (SA/SD) methodology is one such abstract but crucial component of System Design. This article will go through steps to understand Structured Design in Software Engineering and Structured Analysis (SD/SA) in design problems.
Nowadays, system design interviews have become a part of almost every top-notch tech company around the block, making many people afraid of system design interviews as there’s no particular pattern to prepare.
What is structured analysis in software engineering?
A software engineering technique called "structured analysis" uses graphical diagrams to create and present user-friendly system requirements. A methodical process divides a complex system into more manageable, smaller parts. Understanding the system's requirements, design, and implementation is made simpler as a result.
The quality of software development can be raised by using the potent approach of structured analysis. It aids in ensuring that the system is easy to comprehend and maintain and that it is built to satisfy the users' needs.
Structured Analysis Tools
Structured Analysis Tools are techniques and graphical representations used in structured analysis methodologies to understand, analyze, and design complex systems. These tools help in visualizing system requirements, processes, and data flow. Some common structured analysis tools include:
Data Flow Diagrams (DFDs): Graphical representations showing how data moves through a system, depicting processes, data stores, and data flows.
Entity-Relationship Diagrams (ERDs): Illustrate the relationships between different entities in a system, emphasizing data storage and retrieval.
Data Dictionary: Provides a comprehensive list of data elements used in the system, along with their definitions, attributes, and relationships.
Structured English: A textual representation of processes and logic using structured programming constructs, enhancing readability and comprehension.
Decision Trees: Diagrams representing decision points and outcomes, aiding in understanding complex decision-making processes.
State Transition Diagrams: Illustrate the various states of a system and the transitions between these states, useful for modeling system behavior.
Process Specifications: Detailed descriptions of individual system processes, including inputs, outputs, and processing logic.
Data Flow Diagrams or Bubble Chart
Data Flow Diagrams (DFDs) are graphical representations used in structured analysis to depict the flow of data within a system. They illustrate how data moves from external sources through processes and eventually to output destinations or data stores. DFDs consist of various components such as processes, data stores, data flows, and external entities, all interconnected to represent the flow of information within the system.
On the other hand, a bubble chart is a type of chart that displays data points as bubbles or circles on a two-dimensional grid. Each bubble represents a data point, and its size typically correlates with a numerical value associated with that data point. Bubble charts are useful for visualizing and comparing relationships between multiple variables, as the position and size of each bubble convey information about the data it represents. They are often used in data visualization to depict complex datasets and identify patterns or trends.
If you are trying to build a system or upgrade a system then system Analysis and Design is kind of the backbone of it. This is a kind of layout of the whole system.let’s list of some of them.
To improve the quality of the system and thus reducing the occurrences of error in the system. By analysing the problem definitely errors can be reduced.
To manage and to make the flow of the system it is really helpful.
Software development is a process that involves architecture, database and backend development etc, this is what we call analysis which is required to design good software.
Works in the longer run. The analysis helps in keeping in mind to build such a system that may face future challenges too.
It is the analysis and design of the software which makes it different from a cowboy system. Because of this only we get a decent and a system with a future point of view too.
Steps involved in the SA/SD process
Structured Analysis and Structured Design, sometimes known as the SA/SD process, is a well-known software development technique that includes the following steps:
Structured Analysis
Collecting requirements
Modelling of data flow
Modelling of entity-relationships
Modelling of state machines
Using case studies
Detailed Design
System architecture design
Module layout
Interface style
Development of pseudocode
Phases of Structured Analysis and Structured Design (SA/SD)
Structured Analysis and Structured Design (SA/SD) is a diagrammatic notation system design technique designed to help people better understand it. One of Structured Analysis and Structured Design (SA/SD) is to improve quality and reduce the risk of system failure. It establishes concrete management specifications and documentation. It focuses on the reliability, flexibility, and maintainability of the system.
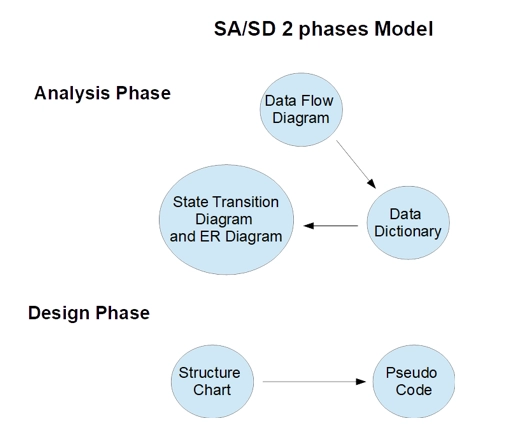
Structured Analysis and Structured Design (SA/SD) comprises the following 2 phases:
Analysis Phase
Design Phase
Analysis Phase
The phase uses diagrammatic system representations using Data Flow Diagram(DFDs), Data Dictionary, State Transition, and ER diagrams. The analysis phase enables the analyst to logically comprehend the system and its operations. Here, the system development process makes use of a variety of tools and methods. It makes use of graphical tools to examine and improve the goals of an existing system and create a new system definition that the user can readily comprehend.
Data Flow Diagram: In a DFD model, describe how the data flows through the system. It is a hierarchical graphical model that mainly shows the system’s different functions (or processes) and the data interchange among the methods.
Image Source - Slideplayer
It is helpful to consider each function as a processing station such that each function consumes some input data and produces some output data.
Image Source - sitsitamarhi.ac.in
The Data Flow diagram Symbols used here, hold the following meaning ->
A directed arc or line here represents data flow in the direction of the arrow where data flow symbols are annotated with names of the data that they carry.
The Data Store Symbol here represents a logical file that can either be a Data Structure or a physical file on a disk. Each data store is connected to a process with the help of a data flow symbol.
The direction of the data flow arrow shows whether data is being read from
or written into it. An arrow into or out of a data store implicitly represents the entire data whereas the arrows connecting to a data store need not be annotated with any data name.
2. Data Dictionary: A DFD is always accompanied by a data dictionary. A data dictionary lists all data items appearing in a DFD defining data stores and their relevant meaning.
3. State Transition Diagram: The State Transition Diagram is similar to the Dynamic model. It specifies how much time the function will take to execute and data access triggered by the various events involved.
The State Transition diagram Symbols used here, hold the following meaning ->
Image Source -dhwwtar19mmjy.apowersoft.info
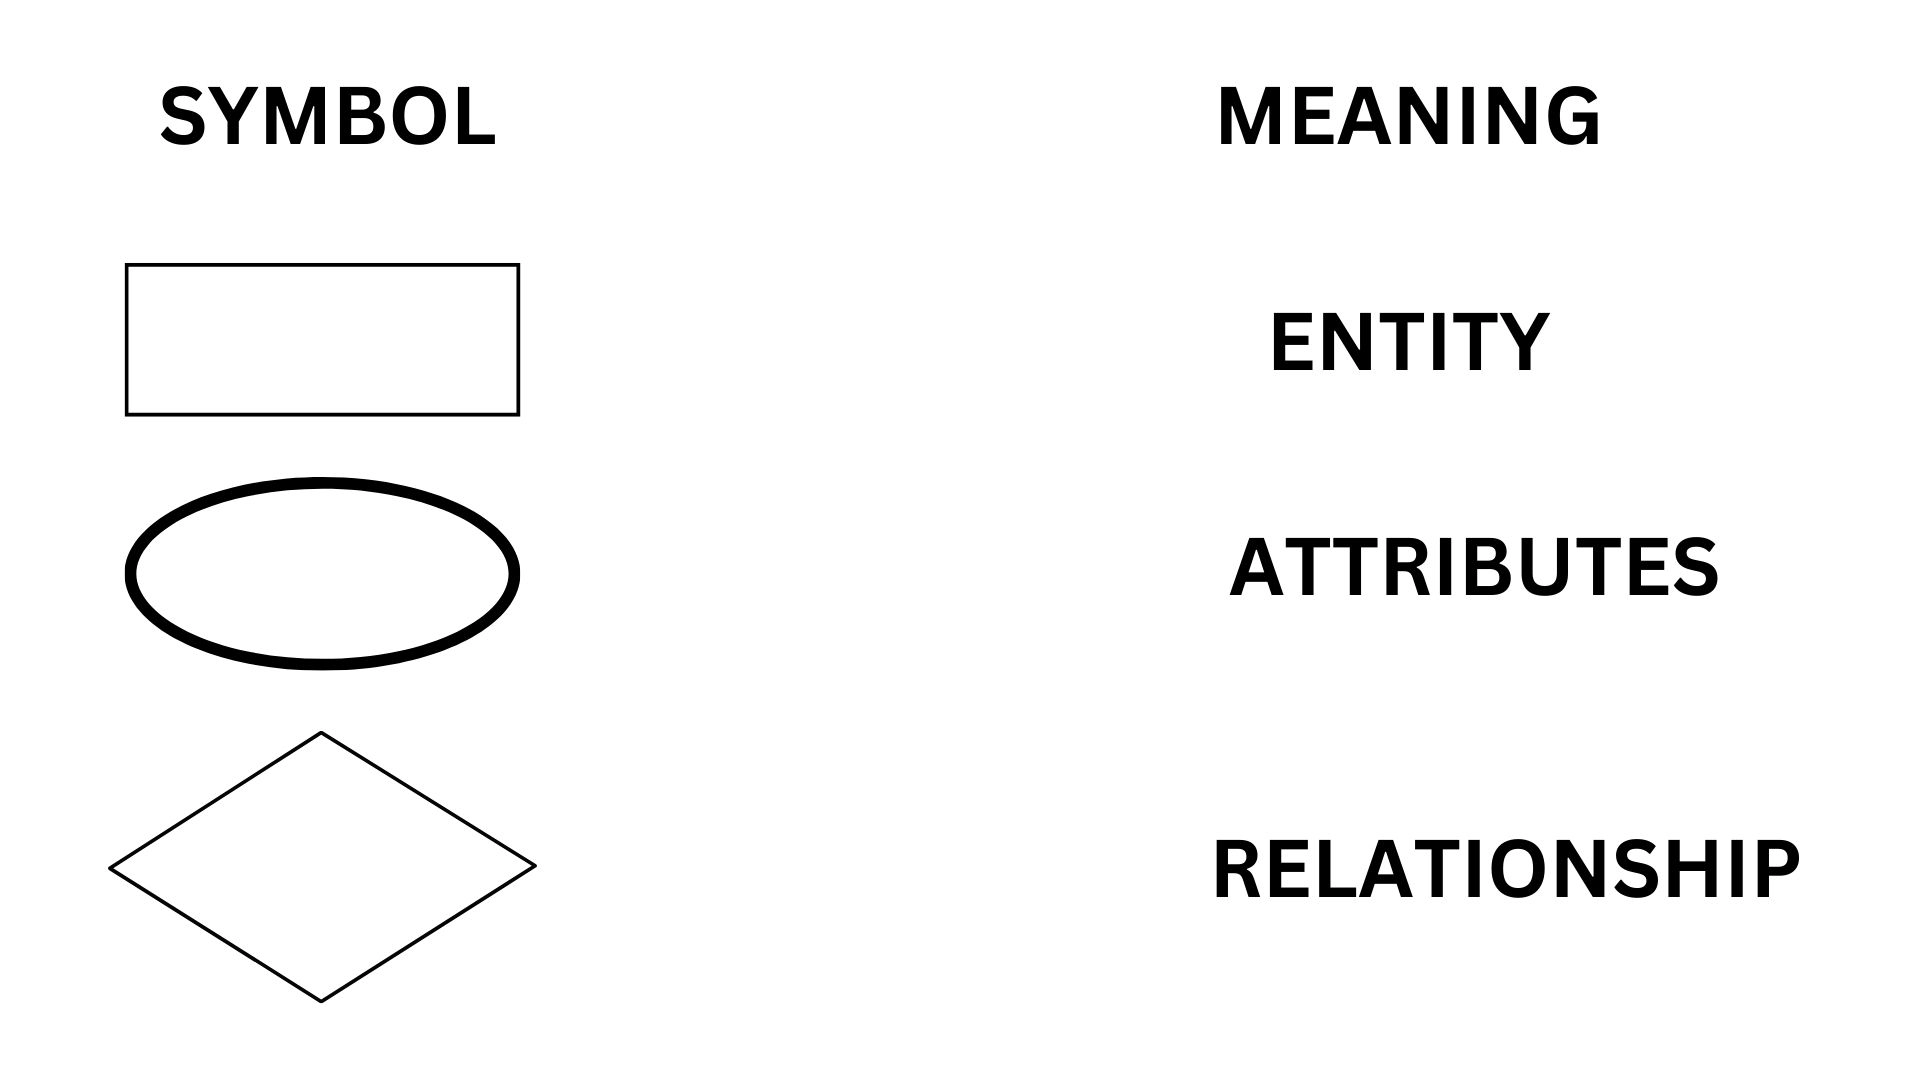
4. ER Diagram: This is a graphical representation of the data layout of a system at a high level of abstraction that defines data elements and their inter-relationships in the design and the relationship between data stores.
Source: Edredo
The Entity-Relationship diagram Symbols used here, hold the following meaning →
Design Phase
Involves the use of a Structure Chart and Pseudo Code to model a system. The high level design or software architecture for the specified problem is another name for this design phase. The goal of phase design is to specify the solution's structure so that it may be put into practise.
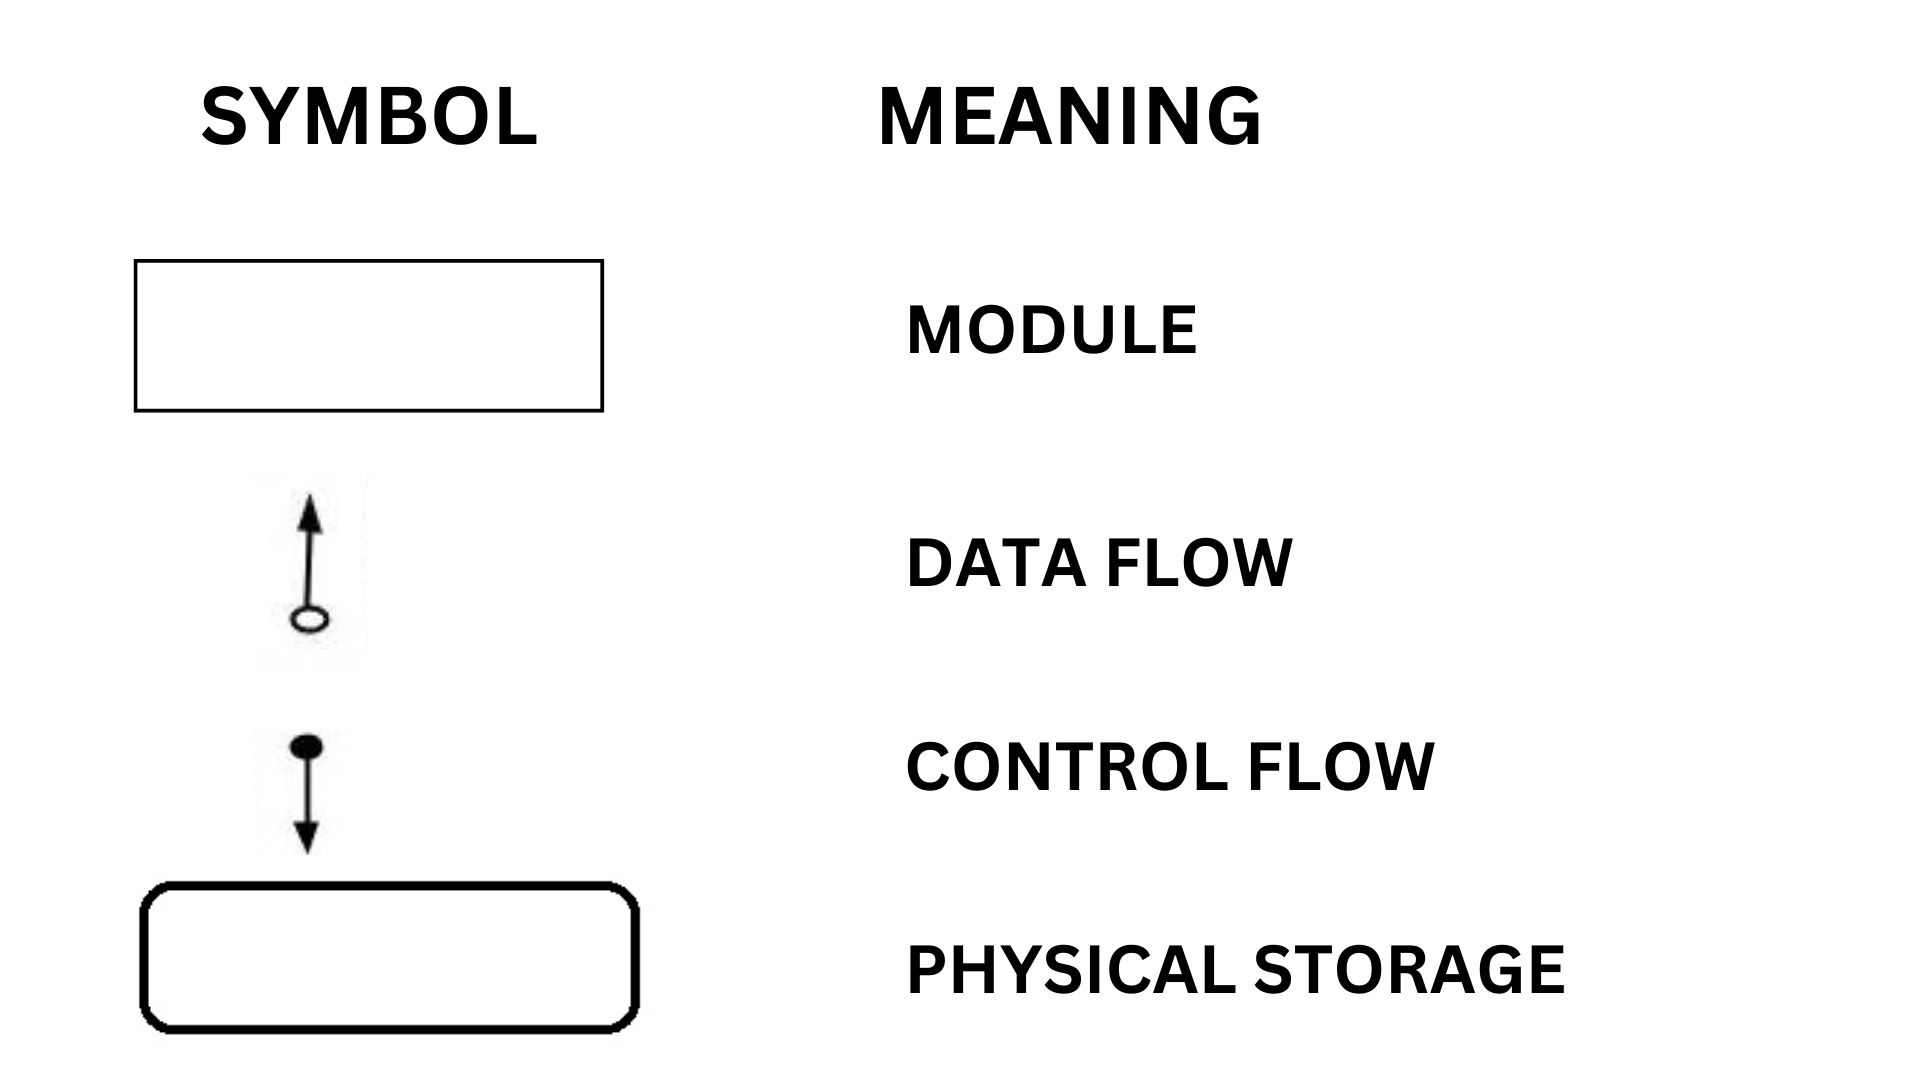
Structure Chart: It is created and defined by the DFD. The structure Chart specifies how a DFD’s processes are grouped into tasks and allocated to CPU’s or other such relative systems.
Source: Slide share CDN
The Structure Chart Symbols used here, hold the following meaning ->
2. Pseudo Code: It is the actual implementation of the system showing the process specifications and implied details but not shown in a DFD.
Source: Slide share CDN
The origins of using a Structured Analysis and Structured Design (SA/SD) approach
Structured Analysis and Structured Design (SA/SD) has a history from way back in the late 1970s modeled by DeMarco, Yourdon, and Constantine after the emergence of the well-known paradigm of modern structured programming. IBM was the first to incorporate Structured Analysis and Structured Design (SA/SD) into its development cycle in the late 1970s and early 1980s.
In contrast, people modified the classical Structured Analysis and Structured Design (SA/SD) due to their inability to represent real-time systems. In 1989, Yourdon came up with another published version of the methodology with a graphical approach known as “Modern Structured Analysis”.
The availability of CASE tools in the 1990s enabled many analysts to develop and modify the graphical Structured Analysis and Structured Design (SA/SD) models. Using this model, analysts attempted to divide a significant, complex problem into smaller, more easily handled ones using a “Divide and Conquer”, “Top-Down approach” (Classical SA), or “Middle-Out” (Modern SA).
Analysts used leverage graphics to illustrate their ideas whenever possible to depict a functional view of the problem and maintain relevant written records.
So, what’s all the fuss about Structured Analysis and Structured Design (SA/SD) anyway?
Structured Analysis and Structured Design (SA/SD) is a top-down decomposition technique system design methodology. In Software Engineering, SA/SD are methods used for analyzing business requirements while developing specifications for converting practices into computer programs, hardware configurations, and related manual procedures.
Structured Analysis is a set of techniques and graphical tools that allow the analyst to develop a new system specification that is easily understandable to the user and a functional, high-quality information system that meets their needs.
Structured Analysis and Structured Design (SA/SD) methodology consist of two significant chunks of different activities, viz. :
Structured Analysis (SA) During which a functional decomposition takes place.
Structured Design (SD) During which module structure is formalized.
Here, Functional decomposition is where each function is analyzed, hierarchically decomposed into more detailed processes, and simultaneously decomposed from high-level data into more complex data.
Structured Analysis is based on principles of the “Top-down decomposition” approach and the “Divide and Conquer” principle, where each function is considered individually (i.e. isolated from other parts). Here, too relatively, a decomposition of different functions occurs, disregarding what happens in other processes (reducing their cohesiveness and increasing independence).
Advantages of Structured Analysis and Structured Design (SA/SD)
Advantages of Structured Analysis and Structured Design (SA/SD):
Clarity and Understandability: SA/SD techniques offer clear and understandable representations of system requirements and designs, aiding in communication among stakeholders.
Modularity: SA/SD promotes modular design, which facilitates easier maintenance, debugging, and enhancement of the system.
Ease of Testing: The structured approach enables systematic testing of individual modules, improving the overall quality and reliability of the system.
Predictability: SA/SD provides a systematic way to analyze requirements and design solutions, leading to predictable outcomes in terms of system behavior and performance.
Reuse: Modular design encourages reusable components, reducing development time and effort for future projects.
Disadvantages of Structured Analysis and Structured Design (SA/SD)
Disadvantages of Structured Analysis and Structured Design (SA/SD):
Rigidity: SA/SD can become rigid and may not accommodate changes well, especially when requirements evolve or new features need to be added.
Complexity Management: Large systems designed using SA/SD may become complex and difficult to manage, leading to increased development time and cost.
Overhead: SA/SD requires significant upfront planning and documentation, which may lead to increased project overhead, especially for small-scale projects.
Limited Scalability: SA/SD may not scale well for extremely large or complex systems, as the modular approach may introduce performance bottlenecks or architectural constraints.
Dependency Management: Dependencies between modules can create challenges during integration and maintenance phases, requiring careful coordination and management.
Guidelines for Selecting Appropriate Tools
For high or low-level analysis, use DFD to provide quality system documentation.
Use a data dictionary to streamline the structure to satisfy the system's data needs.
If there are numerous loops and the actions are complex, use structured English.
When there are a lot of conditions to verify and the reasoning is complicated, use decision tables.
When sequencing of conditions is crucial, and there aren't many to test, use decision trees.Structured Analysis and Design for Designing Systems
Frequently Asked Questions
What is meant by structured analysis?
Initially, represent the software at the most abstract level called the context diagram. Here, the entire system is defined as a single bubble; this bubble is labelled according to the system's primary function.
What are the benefits of structured analysis?
The benefits of structured analysis are: Improves the quality and reduces the risk of system failure It establishes specifications and complete requirements documentations. Also, it focuses on reliability, flexibility, reusability, robustness, maintainability of the system.
What is Structured Analysis and Structured Design?
Structured Analysis and Structured Design (SA/SD) are methodologies in software engineering for analyzing requirements and designing solutions using modular and hierarchical approaches.
What are structured methods in software engineering?
Structured methods in software engineering are systematic approaches for analyzing, designing, and implementing software systems using modular and procedural techniques.
What is a structured analysis model?
A structured analysis model is a graphical representation of a system's requirements and processes, often depicted using data flow diagrams, entity-relationship diagrams, and process specifications.
Conclusion
This blog highlighted the following set of critical takeaways:
Structured Analysis and Structured Design (SA/SD) is a process-driven software analysis technique that uses DFD’s and other relevant diagrams to record the requirements analysis in 2 phases, viz. Analysis and Design Phase.
SASD has a long history in the industry, and it is a mature system design approach that provides good documentation for requirements.
In recent years, it has been widely used for designing and developing complex real-time embedded system’s software.


 9+ registered

