Do you think IIT Guwahati certified course can help you in your career?
Introduction
Data can be represented graphically using charts. Based on the variations in how they are visualized, charts can be classified into many categories. One such graphic representation in which the data series are connected with connection points is the JavaFX Line chart. The class javafx.scene.chart.LineChart can be instantiated to produce a line chart. Let's learn about the JavaFX and JavaFX Line charts.
JavaFX
The JavaFX is an open-source library in Java, which is used to create both desktop and Rich Internet Applications (RIA). It can create next-generation client applications for mobile, desktop, and embedded systems built on Java. The JavaFX replaces the Swing framework as the GUI framework in building the Java applications because it has more features than Swing. JavaFX provides its own components and is independent of the operating system, just like Swing. It is hardware accelerated, lightweight, and supports various operating systems like Windows, Linux, and Mac OS.
JavaFX Line Chart
In a JavaFX line chart, the mapping points are plotted between two number axes, where the markers are placed. These line segments join the markers together to form a JavaFX Line chart. In essence, the line chart displays the difference between the values of one axis and the change in the values of the other axis. The class javafx.scene.chart in JavaFX is used to represent Line Charts.
Syntax of JavaFX Line Chart:
Import javafx.scene.chart.LineChart // Import the LineChart class
LineChart ll = new LineChart(x, y); // Create a new line chart object
The JavaFX Line Chart class contains two constructors based on the parameters passed to the constructors. They are:
Public LineChart(Axis Xaxis, Axis Yaxis ): creates a new LineChart object with the chosen axis.
Public LineChart(Axis Xaxis, Axis Yaxis, ObservableList<xy.chartseries> data): create the new instance of LineChart with the chosen axis and data.
Properties
The following table lists the class's properties and setter methods.
The y-axis and x-axis must be configured with the specific coordinates and a label to draw the JavaFX Line chart.
//x-axis representation
final NumberAxis xaxis = new NumberAxis(2008,2018,1);
xaxis.setLabel("Year");

//y-axis representation
final NumberAxis yaxis = new NumberAxis(10,80,5);
yaxis.setLabel("Price");
You can also try this code with Online Java Compiler
The creation of an instance of the XYChart series is the essential phase in creating a JavaFX Line chart. The values shown in the chart will be added using the syntax below.
//to create the series
XYChart.Series series = new XYChart.Series();

//set the name and the data to the series
series.setName("Stock Analysis");

series.getData().add(new XYChart.Data(2017,78));
series.getData().add(new XYChart.Data(2010,15));
series.getData().add(new XYChart.Data(2011,68));
series.getData().add(new XYChart.Data(2012,60));
series.getData().add(new XYChart.Data(2013,35));
series.getData().add(new XYChart.Data(2014,55));
series.getData().add(new XYChart.Data(2015,45));
series.getData().add(new XYChart.Data(2016,67));
series.getData().add(new XYChart.Data(2009,25));
You can also try this code with Online Java Compiler
A group needs to be created to put together all the data. Once the group has been formed, the class javafx.scene is instantiated to generate the scene. The only argument in the scene that may be accepted is the group.
//setting Group and Scene
Group root = new Group(linechart);
Scene scene = new Scene(root,600,400);
primaryStage.setScene(scene);
primaryStage.setTitle("LineChart Example");
primaryStage.show();
You can also try this code with Online Java Compiler
Below is the Java program, which generates a line chart.
package application;
import javafx.application.Application;
import javafx.scene.Group;
import javafx.scene.Scene;
import javafx.scene.chart.XYChart;
import javafx.scene.chart.LineChart;
import javafx.scene.chart.NumberAxis;
import javafx.stage.Stage;
public class LineChartTest extends Application
{
    @Override
    public void start(Stage primaryStage) throws Exception {
        // TODO Auto-generated method stub
        // Configuring Xaxis and Yaxis
        final NumberAxis x = new NumberAxis(2008,2018,1);
        final NumberAxis y = new NumberAxis(10,80,5);

        //Define the label for Axis
        x.setLabel("Year");
        y.setLabel("Price");

        //Creating the instance of linechart with the specified axis
        LineChart linechart = new LineChart(x,y);

        //creating the series
        XYChart.Series series = new XYChart.Series();

        //set the name and the date to the series
        series.setName("Stock Analysis");
        series.getData().add(new XYChart.Data(2009,25));
        series.getData().add(new XYChart.Data(2010,15));
        series.getData().add(new XYChart.Data(2011,68));
        series.getData().add(new XYChart.Data(2012,60));
        series.getData().add(new XYChart.Data(2013,35));
        series.getData().add(new XYChart.Data(2014,55));
        series.getData().add(new XYChart.Data(2015,45));
        series.getData().add(new XYChart.Data(2016,67));
        series.getData().add(new XYChart.Data(2017,78));

        //adding series to the linechart
        linechart.getData().add(series);

        //setting Group and Scene
        Group root = new Group(linechart);
        Scene scene = new Scene(root,600,400);
        primaryStage.setScene(scene);
        primaryStage.setTitle("LineChart Example");
        primaryStage.show();
    }

    public static void main(String[] args) {
        launch(args);
    }
}
You can also try this code with Online Java Compiler
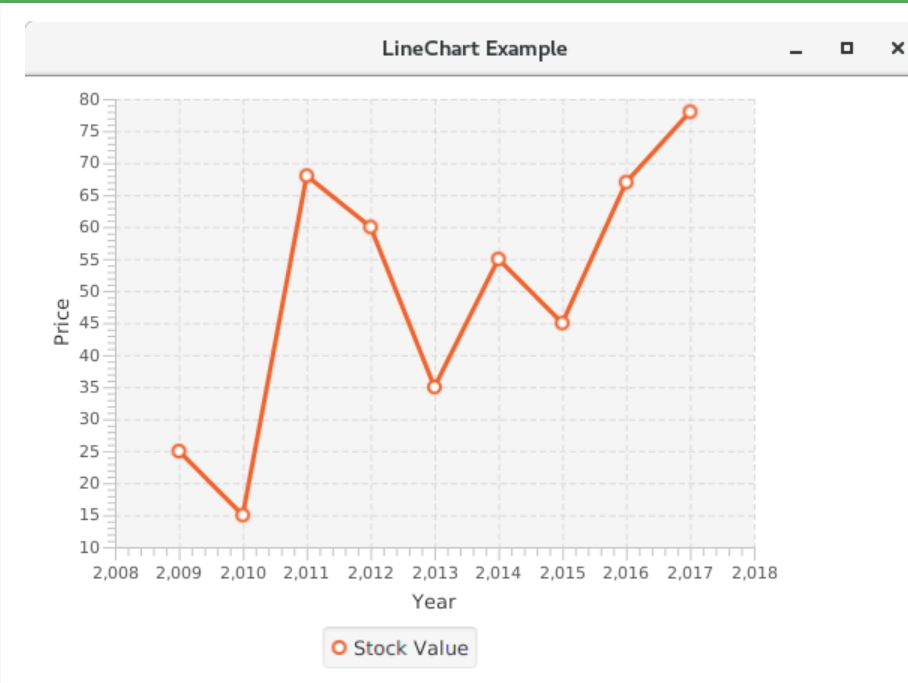
The above program creates a JavaFX window that displays a JavaFX Line chart, as seen below.
Output
Frequently Asked Questions
Why do we use the JavaFX Line chart?
The JavaFX Line chart is a type of two-axis chart used to show the dynamics of any data or product over a particular time interval. They are created by plotting a series of points that can represent changes over a short or long period.
Are pie charts comparable?
Pies shouldn't typically be used to compare data across pies, judge the relative sizes of categories, or show percentages that don't add up to 100%.
What three elements make up a JavaFX application?
A JavaFX application will typically consist of three main parts:
Stage
Scene
Nodes.
What are the three life cycle methods of the JavaFX application?
The three life cycle methods of JavaFX application are:-
public void init()
public abstract void start(Stage primaryStage)
public void stop()
What are the types of line charts?
There are three types of Line charts in Java. They are
Simple Line Chart
Multiple Line Chart
Compound Line Chart
Conclusion
In this article, we have discussed JavaFX Line Chart. You can now create your own JavaFX Line Chart to represent any dynamic data.


 8+ registered

