Do you think IIT Guwahati certified course can help you in your career?
Introduction
Have you ever plotted a graph on a cartesian plane? I am sure you have. We all have plotted a graph at least once. In contrast, there is often a requirement for charts in developing applications. So how do we do that? JavaFX has a stacked area chart class that does all the hard work and gives the developer simple functions to achieve this. Let's jump right into the details of the Stacked Area Chart class.
Stacked Area Chart
A stacked area chart is similar to the area chart of the JavaFX library. 'javafx.scene.chart.StackedAreaChart' class represents Stacked Area Chart in JavaFX. It shows the relationship between various quantities concerning similar entities. A stack of the area is made, which means different amounts.
public StackedAreaChart( x-axis, y-axis): It initialises the stacked area chart object with the specified axes.
public StackedAreaChart( x-axis, y-axis, dataList): It initialises the stacked area chart object with the specified axes and feeds in data.
Sample Program
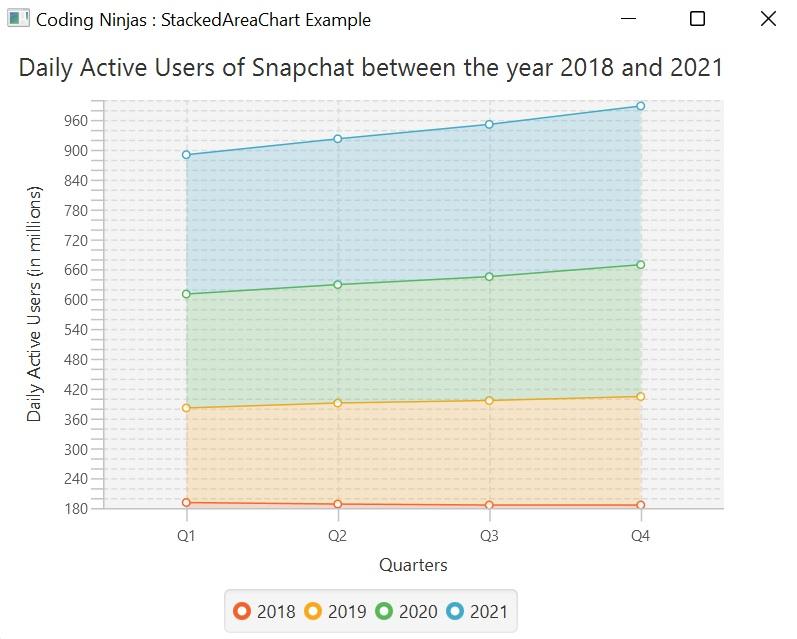
To understand the implementation of a stacked area chart, let us create a sample project to plot the daily active users of Snapchat quarter-wise for the year range 2018-2021.
Step 1: Create a class and extend it to the Application class in the 'javafx.application' package. After this, use the 'start' method of the 'application' class.
Use the CategoryAxis and NumberAxis methods to create axes and set start, end and partition sizes.
// Creating x-axis and y-axis CategoryAxis xaxis = new CategoryAxis(); NumberAxis yaxis = new NumberAxis(180,1000,20); xaxis.setLabel("Quarters"); yaxis.setLabel("Daily Active Users (in millions)");
Step 3: Create a new stacked area chart object and give a title
Use the StackedAreaChart method of the javafx.scene.chart package to create a new object. Pass x and y-axis objects as arguments.
//Creating StackedAreaChart and setting up the title StackedAreaChart CodingNinjas = new StackedAreaChart(xaxis,yaxis); CodingNinjas.setTitle("Daily Active Users of Snapchat between the year 2018 and 2021");
Step 4: Configuring Series and adding data to the series
//Setting up year1 XYChart.Series year1 = new XYChart.Series<>(); year1.getData().add(new XYChart.Data("Q1",191)); year1.getData().add(new XYChart.Data("Q2",188)); year1.getData().add(new XYChart.Data("Q3",186)); year1.getData().add(new XYChart.Data("Q4",186));
Step 5: Attach data to the scatter chart object
//adding year1 to the StackedAreaChart CodingNinjas.getData().add(year1); year1.setName("2018");
Step 6: Setting up the group and viewport properties
Use the Group method and the root object to add the StackedAreaChart object. Create the scene object and add it to the stage object (here view).
//Creating group object and setting up scene Group root = new Group(); root.getChildren().add(CodingNinjas); Scene scene = new Scene(root,600,400); stage.setScene(scene); stage.setTitle("Coding Ninjas : StackedAreaChart Example"); stage.show();
Step 7: Launch the application
Launch the application using the launch method of the Application class from the main method.
publicstaticvoidmain(String[] args) { launch(); }
CodingNinjas.java
//Coding Ninjas :) //This is the code for sample JavaFX StackedAreaChart implementation package com.example.stackedareachart;
publicclassCodingNinjasextendsApplication { //start method of Application class used @Override publicvoidstart(Stage stage) throws IOException { // TODO Auto-generated method stub // Creating x-axis and y-axis CategoryAxis xaxis = new CategoryAxis(); NumberAxis yaxis = new NumberAxis(180,1000,20); xaxis.setLabel("Quarters"); yaxis.setLabel("Daily Active Users (in millions)");
//Creating StackedAreaChart and setting up the title StackedAreaChart CodingNinjas = new StackedAreaChart(xaxis,yaxis); CodingNinjas.setTitle("Daily Active Users of Snapchat between the year 2018 and 2021");
//Setting up year1 XYChart.Series year1 = new XYChart.Series<>(); year1.getData().add(new XYChart.Data("Q1",191)); year1.getData().add(new XYChart.Data("Q2",188)); year1.getData().add(new XYChart.Data("Q3",186)); year1.getData().add(new XYChart.Data("Q4",186));
//adding year1 to the StackedAreaChart CodingNinjas.getData().add(year1); year1.setName("2018");
//Setting up year2 XYChart.Series year2 = new XYChart.Series<>(); year2.getData().add(new XYChart.Data("Q1",190)); year2.getData().add(new XYChart.Data("Q2",203)); year2.getData().add(new XYChart.Data("Q3",210)); year2.getData().add(new XYChart.Data("Q4",218));
//Adding year2 to the StackedAreaChart CodingNinjas.getData().add(year2); year2.setName("2019"); //Setting up year3 XYChart.Series year3 = new XYChart.Series<>(); year3.getData().add(new XYChart.Data("Q1",229)); year3.getData().add(new XYChart.Data("Q2",238)); year3.getData().add(new XYChart.Data("Q3",249)); year3.getData().add(new XYChart.Data("Q4",265));
//Adding year3 to the StackedAreaChart CodingNinjas.getData().add(year3); year3.setName("2020");
//Setting up year4 XYChart.Series year4 = new XYChart.Series<>(); year4.getData().add(new XYChart.Data("Q1",280)); year4.getData().add(new XYChart.Data("Q2",293)); year4.getData().add(new XYChart.Data("Q3",306)); year4.getData().add(new XYChart.Data("Q4",319));
//Adding year4 to the StackedAreaChart CodingNinjas.getData().add(year4); year4.setName("2021");
//Creating group object and setting up scene Group root = new Group(); root.getChildren().add(CodingNinjas); Scene scene = new Scene(root,600,400); stage.setScene(scene); stage.setTitle("Coding Ninjas : StackedAreaChart Example"); stage.show();
JavaFX is an open-source Software Development Kit for building feature-rich and modern GUI desktop and web applications. It is the outcome of the collaboration of a large pool of developers and companies to produce a toolkit to develop modern client applications.
What is a chart?
Charts are 2D graphs in the JavaFX library to show the relationship between different variables on a cartesian plane. ScatterChart, LineChart, AreaChart etc., are some examples of Charts in JavaFX.
What is a package?
A package is a namespace similar to a folder where you can put your source files. It organises related classes and interfaces. You might keep java code in one folder, images in other and so on.
Conclusion
Finally, you have made it to the end of this article. Congratulations!! In this blog, you learnt about the Stacked Area Chart class in JavaFX. You went through the class, its constructors and a sample program.
After reading about stacked area charts in JavaFX, are you not feeling excited to read more articles on the topic of JavaFX? Don't worry; Coding Ninjas has you covered. To learn, see the JavaFX.


 9+ registered

