Steps to Generate Stacked Bar Chart
Follow the instructions here to create a Stacked Bar Chart in JavaFX.
Step 1: Class Creation
Create a Java class that inherits the Application class from the JavaFX.application package. You can then implement this class's start() method as follows.
public class ClassName extends Application {
   @Override
   public void start(Stage primaryStage) throws Exception {
   }
}
Step 2: Defining the Axis
Define the stacked bar chart's X and Y axes and assign labels to them. The X-axis in our example depicts the continents, whereas the Y-axis indicates the population in millions.
//x axis
CategoryAxis xAxis = new CategoryAxis();
xAxis.setCategories(FXCollections.<String>observableArrayList(Arrays.asList
("Africa", "America", "Asia", "Europe", "Antarctica")));
xAxis.setLabel("category");

//y axis
NumberAxis yAxis = new NumberAxis();
yAxis.setLabel("Population (In millions)");
Step 3: Stacked Bar Chart Creation
Create a line chart by invoking the StackedBarChart class from the JavaFX.scene.chart library. Pass the X and Y representational items around axes created in the previous step to the function Object() { [native code] } of this class.
//the stacked bar chart
StackedBarChart<String, Number> stackedBarChart =
new StackedBarChart<>(xAxis, yAxis);
stackedBarChart.setTitle("World Population by Region");
Step 4: Preparing the Data
Create an instance of a series of x and y coordinates) to the class's Observable list using the XYChart.Series class is as follows:
//Preparing XYChart.Series objects
XYChart.Series<String, Number> series1 = new XYChart.Series<>();
series1.setName("1800");
series1.getData().add(new XYChart.Data<>("Africa", 107));
series1.getData().add(new XYChart.Data<>("America", 31));
series1.getData().add(new XYChart.Data<>("Asia", 635));
series1.getData().add(new XYChart.Data<>("Europe", 203));
series1.getData().add(new XYChart.Data<>("Antarctica", 2));
XYChart.Series<String, Number> series2 = new XYChart.Series<>();

series2.setName("1900");
series2.getData().add(new XYChart.Data<>("Africa", 133));
series2.getData().add(new XYChart.Data<>("America", 156));
series2.getData().add(new XYChart.Data<>("Asia", 947));
series2.getData().add(new XYChart.Data<>("Europe", 408));
series1.getData().add(new XYChart.Data<>("Antarctica", 6));

XYChart.Series<String, Number> series3 = new XYChart.Series<>();
series3.setName("2008");
series3.getData().add(new XYChart.Data<>("Africa", 973));
series3.getData().add(new XYChart.Data<>("America", 914));
series3.getData().add(new XYChart.Data<>("Asia", 4054));
series3.getData().add(new XYChart.Data<>("Europe", 732));
series1.getData().add(new XYChart.Data<>("Antarctica", 34));
Step 5: Adding Data to the Stacked Bar Chart
Add the data series created in the previous step to the bar chart by doing the following:
//Setting the data to a bar chart
stackedBarChart.getData().addAll(series1, series2, series3);
Step 6: A Group Object Creation
Create a group object by instantiating the Group class in the start() method. This is part of the JavaFX.scene package.
Pass the StackedBarChart (node) object created in the preceding step as an argument to the Group class's function Object() { [native code] }. This should be done in order to add it to the group:
//Creating root group
Group root = new Group(stackedBarChart);
Step 7: Creating a Scene Object
Instantiate the Scene class from the JavaFX.scene package to create a new Scene. Pass the Group object (root) that was created in the previous step to this class.
You can pass an object of the Group class along with the root object and two double parameters that represent the screen's height and width as seen in the example below.
Scene scene = new Scene(group ,500, 200);
Step 8: Setting the Title of the Stage
Using the setTitle() method of the Stage class, you can change the stage's title. This primaryStage is a Stage object that is supplied as a parameter to the start method of the scene class.
Set the scene's title to Sample Application using the primaryStage object.
primaryStage.setTitle("Sample Application");
Step 9: Displaying the Contents of the Stage
The Stage class's show() method can be used to display the scene's contents.
primaryStage.show();
Step 10: Launching the Application
The static method launch() of the Application class should be called from the main function to start the JavaFX application.
public static void main(String args[]){
    launch(args);
 }
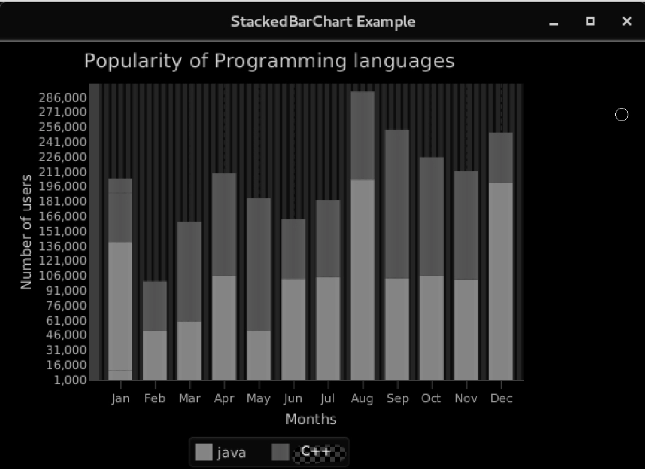
Example Application
The popularity of two programming languages in each month of the year is contrasted in the example below. While the y-axis is a number axis, the x-axis is a category axis. We have put the months of a year on the X-axis and the number of readers on the Y-axis.
Implementation
Code:
package application;
import javafx.application.Application;
import javafx.scene.Group;
import javafx.scene.Scene;
import javafx.scene.chart.CategoryAxis;
import javafx.scene.chart.NumberAxis;
import javafx.scene.chart.StackedBarChart;
import javafx.scene.chart.XYChart;
import javafx.stage.Stage;
public class StackedBarChartExample extends Application{
@Override
public void start(Stage primaryStage) throws Exception {

    //Configuring xaxis and yaxis
    CategoryAxis xaxis = new CategoryAxis();
    NumberAxis yaxis = new NumberAxis(1000,300000,1000);
    xaxis.setLabel("Months");
    yaxis.setLabel("Number of users");

    //Configure the StackedBarChart
    StackedBarChart sb = new StackedBarChart(xaxis,yaxis);
    sb.setTitle("Popularity of Programming languages");

    XYChart.Series java = new XYChart.Series<>();
    java.setName("java");
    java.getData().add(new XYChart.Data<>("Jan",10000));
    java.getData().add(new XYChart.Data<>("Jan",130000));
    java.getData().add(new XYChart.Data<>("Feb",50000));
    java.getData().add(new XYChart.Data<>("Mar",60300));
    java.getData().add(new XYChart.Data<>("Apr",105600));
    java.getData().add(new XYChart.Data<>("May",50600));
    java.getData().add(new XYChart.Data<>("Jun",103000));
    java.getData().add(new XYChart.Data<>("Jul",104500));
    java.getData().add(new XYChart.Data<>("Aug",203000));
    java.getData().add(new XYChart.Data<>("Sep",103400));
    java.getData().add(new XYChart.Data<>("Oct",105600));
    java.getData().add(new XYChart.Data<>("Nov",102400));
    java.getData().add(new XYChart.Data<>("Dec",200000));

    //Add series java to the stackedbarchart
    sb.getData().add(java);

    //Configuring series C++
    XYChart.Series C++ = new XYChart.Series<>();
    C++.setName("C++");
    C++.getData().add(new XYChart.Data<>("Jan",50000));
    C++.getData().add(new XYChart.Data<>("Jan",14300));
    C++.getData().add(new XYChart.Data<>("Feb",50400));
    C++.getData().add(new XYChart.Data<>("Mar",100500));
    C++.getData().add(new XYChart.Data<>("Apr",104000));
    C++.getData().add(new XYChart.Data<>("May",134000));
    C++.getData().add(new XYChart.Data<>("Jun",60000));
    C++.getData().add(new XYChart.Data<>("Jul",78000));
    C++.getData().add(new XYChart.Data<>("Aug",89000));
    C++.getData().add(new XYChart.Data<>("Sep",150000));
    C++.getData().add(new XYChart.Data<>("Oct",120000));
    C++.getData().add(new XYChart.Data<>("Nov",109450));
    C++.getData().add(new XYChart.Data<>("Dec",50450));

    //adding C++ series to the stackedbarchart
    sb.getData().add(C++);

    //Configuring group and Scene
    Group root = new Group();
    root.getChildren().add(sb);
    Scene scene = new Scene(root,600,400);
    primaryStage.setScene(scene);
    primaryStage.setTitle("StackedBarChart Example");
    primaryStage.show();
}
public static void main(String[] args) {
    launch(args);
}
}
Output
Frequently Asked Questions
What are the disadvantages of stacked charts?
Even if the material is brief, reading it gets more difficult when more variables are added. Larger Error possibility: A stacked bar chart appears to have a higher error chance than other visual aids like a pie chart.
What situations call for stacked bar charts?
The ideal applications for bar charts are comparisons between categories. The bars are typically drawn either horizontally or vertically and are proportional to the values they reflect. The comparison categories are shown on one axis of the chart, while discrete values are shown on the other axis.
What's the process of a stacked bar chart?
To display the sum or average of each category, a stacked bar chart is utilised. The volume of those numerical values increases with increasing bar height. The stacked bar graph below shows how each category compares to the average through the bars. The sum for each category is displayed in the bottom bar.
Conclusion
In this blog, we have extensively discussed the Stacked Bar Chart. We hope that this article has helped all of you with additional information about the JFX Stacked Bar Chart. And to learn in-depth about Structure-execution, check out the course on our JavaFX on the Coding Ninjas website. For more information about JavaFX, you can check out JavaFX-CodingNinjas and JavaFX.
Also, take a look at the Coding Ninjas website for some great information, Android Development, Coding Ninjas Studio Problems, Coding Ninjas Studio Interview Bundle, Coding Ninjas Studio Interview Experiences, Coding Ninjas Courses, Coding Ninjas Studio Contests, and Coding Ninjas Studio Test Series. Do upvote our blog to help other ninjas grow.
Delighted Programming!


 9+ registered

