Do you think IIT Guwahati certified course can help you in your career?
Introduction
Hello and welcome, readers! We hope you are doing well.
Charts are typically used to show enormous amounts of data and the relationships between different data elements. To depict various types of information, we can make a variety of charts.
Today, in this article, we will discuss the JavaFX Charts. We will show you different types of charts with proper explanations. So follow the article till the end.
So, without further ado, let’s start our discussion.
JavaFX Charts
A chart is a graph or diagram that uses symbols to depict the data. We can represent large amounts of data and the relationships between different data components via charts. To display various types of information, we can make a variety of charts, including bar, pie, scatter, and line diagrams. JavaFX alsosupports numerous XY and Pie Charts.
AreaChart, BarChart, BubbleChart, LineChart, ScatterChart, StackedAreaChart, StackedBarChart, etc., are some charts that can be displayed on an XY-plane.
We can build charts using the classes offered by the package javafx.scene.chart in JavaFX.
Before we move on to our Java codes, you can brush up your Java skills by watching our Youtube video on Java.
Types of Axis in JavaFX Charts
An axis in JavaFX is an abstract class symbolising an X-axis or Y-axis. It has two subclasses, CategoryAxis and NumberAxis, to specify each sort of axis.
Number Axis
The precise range of values is shown on the Number axis.The javafx.scene.chart.NumberAxis class is used in JavaFX to represent the value axis. To build the Number axis, we only need to instantiate this class.
//Defining the value axis
NumberAxis yAxis = new NumberAxis();
//Setting label to the axis
yAxis.setLabel("name of the axis");
You can also try this code with Online Java Compiler
The category axis shows how the information is divided into various categories. It is different from the value axis because it does not display precise values.
The javafx.scene.chart.CategoryAxis class is used in JavaFX to represent the category axis. To build the category axis, we only need to instantiate this class.
//Defining category axis
CategoryAxis xAxis = new CategoryAxis();
//Setting label to the axis
xAxis.setLabel("name of the axis ");
You can also try this code with Online Java Compiler
In this section, we will show you how to create JavaFX Charts:
Configure the Axes
First, specify what information belongs on the chart's X and Y axes. Then, configure the axes using one of two techniques.
While mentioning a category, use the CategoryAxis.
While mentioning a numerical value, use the NumberAxis.
For example, below is an example of mentioning numerical details:
//x-axis representation
NumberAxis x = new NumberAxis();
x.setLabel("Total number of Sections");

//y axis representation
NumberAxis y = new NumberAxis();
y.setLabel("Students per section");
You can also try this code with Online Java Compiler
The creation of an instance of XYChart.Series is the most crucial stage in this procedure. The number of series equals the number of chart entities. The chart can be fed data using the following syntax.
XYChart.Series sr = new XYChart.Series();
You can also try this code with Online Java Compiler
import javafx.application.Application;
import javafx.scene.Scene;
import javafx.stage.Stage;
import javafx.scene.chart.*;
import javafx.scene.Group;
public class App extends Application {
// launch application
public void start(Stage stage) {
stage.setTitle("Example of Chart");
// x-axis representation
NumberAxis x = new NumberAxis();
x.setLabel("Total number of Sections");
// y axis representation
NumberAxis y = new NumberAxis();
y.setLabel("Students per section");
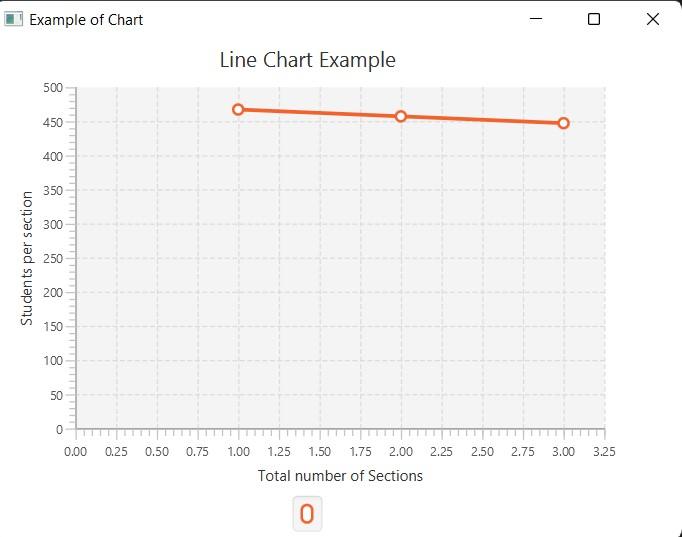
  LineChart<Number,Number> lc = new LineChart<Number,Number>(x, y);
  lc.setTitle("Line Chart Example");
XYChart.Series sr = new XYChart.Series();
  sr.getData().add(new XYChart.Data(1, 467));
  sr.getData().add(new XYChart.Data(2, 457));
  sr.getData().add(new XYChart.Data(3, 447));
 Group gp = new Group();
 gp.getChildren().add(lc);
Scene sc = new Scene(gp, 550, 400);
lc.getData().add(sr);
stage.setScene(sc);
stage.show();
}
public static void main(String args[]) {
// launch the application
launch(args);
}
}
You can also try this code with Online Java Compiler
The charts (classes) offered by JavaFX are described below.
Pie Chart
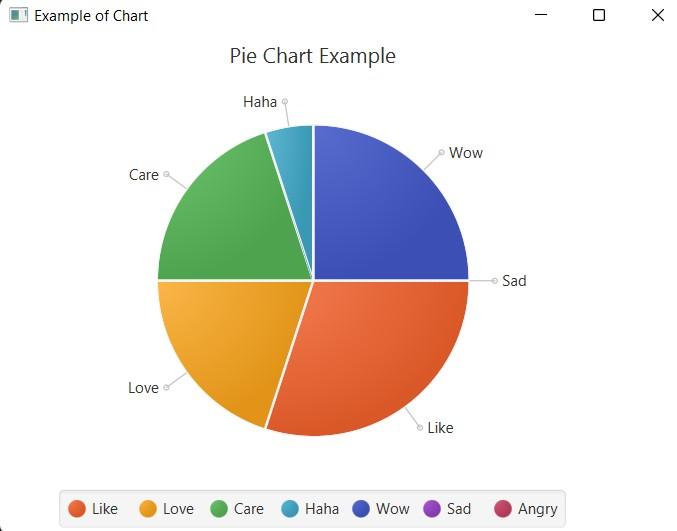
A pie chart is a variety of charts or diagrams in which the sectors of a circle represent various percentages of the total amount of information. The amount of data each sector represents is reflected in the angle of its arc.
Pie Chart is represented in JavaFX by theclass javafx.scene.chart. PieChrt.
Syntax:
ObservableList<PieChart.Data> data = FXCollections.observableArrayList(
                new PieChart.Data("Like", 30),
                new PieChart.Data("Love", 20),
                new PieChart.Data("Care", 20),
                new PieChart.Data("Haha", 5),
                new PieChart.Data("Wow", 25),
                new PieChart.Data("Sad", 0),
                new PieChart.Data("Angry", 0));
 PieChart chart = new PieChart(data);
You can also try this code with Online Java Compiler
A line chart is a particular sort of graph in which a set of markers are used to depict a collection of data points. The straight-line segments join the data points together.
Line Chart is represented in JavaFX by the class javafx.scene.chart.LineChart
Syntax:
 // x-axis representation
 NumberAxis x = new NumberAxis();
 x.setLabel("Total number of Sections");

 // y axis representation
 NumberAxis y = new NumberAxis();
 y.setLabel("Students per section");
 LineChart<Number,Number> lc = new LineChart<Number,Number>(x, y);
 lc.setTitle("Line Chart Example");
You can also try this code with Online Java Compiler
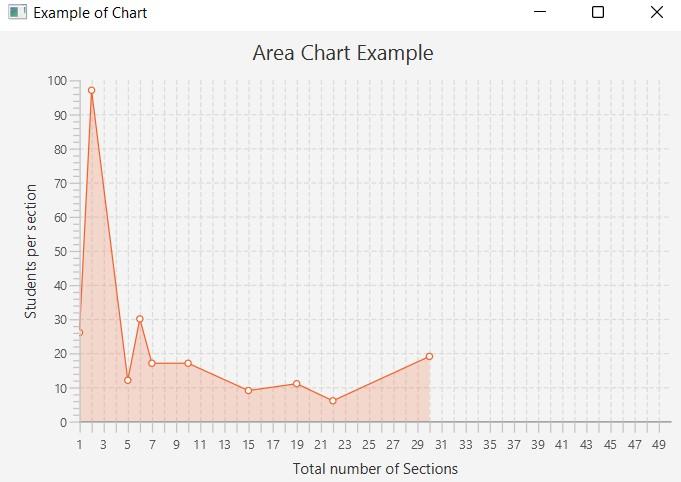
The quantitative data are shown graphically using the area chart. An XY Plane essentially maps the region for the collection of points.
Area Chart is represented in JavaFX by the class javafx.scene.chart.AreaChart.
Syntax:
        // x-axis representation
        NumberAxis x = new NumberAxis(1 , 50, 1);
        x.setLabel("Total number of Sections");

        // y axis representation
        NumberAxis y = new NumberAxis();
        y.setLabel("Students per section");

        AreaChart<Number, Number> chart = new AreaChart<Number, Number>(x, y);
        chart.setTitle("Area Chart Example");
You can also try this code with Online Java Compiler
A diagram in which rectangular bars are used to depict numerical data values is known as a bar chart. According to the numerical values, the height of the bars fluctuates.
Bar Chart is represented in JavaFX by the class javafx.scene.chart.BarChart.
Syntax:
       // x axis
        CategoryAxis x = new CategoryAxis();
        x.setLabel("Section");

        // y axis
        NumberAxis y = new NumberAxis();
        y.setLabel("Number of Students");

        // bar chart creation
        BarChart<String,Number> bc = new BarChart<String,Number>(x, y);
You can also try this code with Online Java Compiler
A bubble chart is a diagram that shows three-dimensional data according to one definition. Each object is represented as a bubble with three triplets (v1, v2, v3). The (X, Y) location indicates two of the triplets, while the bubble's radius indicates the third.
Bubble Chart is represented in JavaFX by the class javafx.scene.chart.BubbleChart.
Syntax:
 NumberAxis x = new NumberAxis(1, 30, 1);
        x.setLabel("X axis");
        NumberAxis y = new NumberAxis(30, 45, 1);
        y.setLabel("Y axis");

        BubbleChart<Number,Number> chart = new BubbleChart<Number,Number>(x, y);
        chart.setTitle("Bubble Chart Example");
You can also try this code with Online Java Compiler
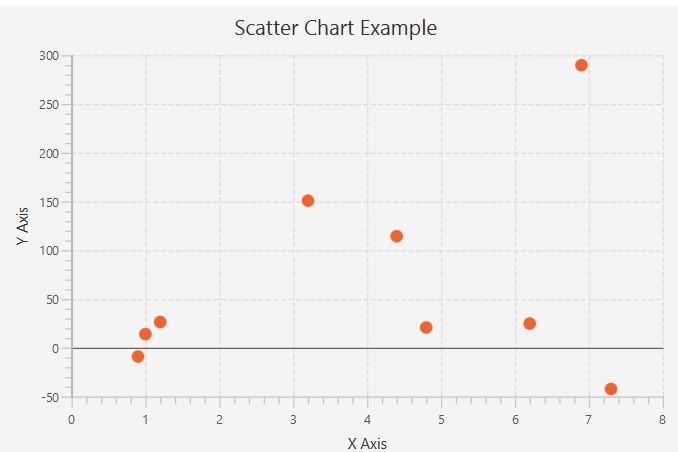
The data points in a scatter chart are dispersed all over the graph. Each data point shows how the two axes are mapped. The relationship between the two variables on the two axes is mostly plotted using it.
Scatter Chart is represented in JavaFX by the class javafx.scene.chart.ScatterChart.
Syntax:
   NumberAxis x = new NumberAxis(0, 8, 1);
        x.setLabel("X Axis");
        NumberAxis y = new NumberAxis(-50, 300, 50);
        y.setLabel("Y Axis");
        //scatter chart syntax
        ScatterChart<Number, Number> chart = new ScatterChart(x , y);
        chart.setTitle("Scatter Chart Example");
You can also try this code with Online Java Compiler
The stacked area chart expands the standard area chart that shows the change in values for multiple groups on the same graphic. The area is plotted for all the data points in a given group.
The stacked Area Chart is represented in JavaFX by the class javafx.scene.chart.StackedAreaChart.
Syntax:
 NumberAxis x = new NumberAxis(0, 8, 1);
        x.setLabel("X Axis");
        NumberAxis y = new NumberAxis(-50, 500, 50);
        y.setLabel("Y Axis");

        //stacked area chart
        StackedAreaChart<Number, Number> chart = new StackedAreaChart(x, y);
        chart.setTitle("Stacked Area Chart Example");
You can also try this code with Online Java Compiler
The values of the various groups are shown on a rectangular bar in the shape of a stack in stacked bar charts. The length of the bar drawn on the graph is mainly used to compare the values of the various groups.
The stacked Bar Chart is represented in JavaFX by the class javafx.scene.chart.StackedBarChart.
Syntax:
 CategoryAxis x = new CategoryAxis();
        x.setLabel("Section");

        // y axis
        NumberAxis y = new NumberAxis();
        y.setLabel("Number of Students");

        // bar chart creation
        StackedBarChart<String,Number> chart = new StackedBarChart<String,Number>(x, y);
        chart.setTitle("Stacked Bar Chart Example");
You can also try this code with Online Java Compiler
A chart is a visual depiction of data in general. We can visualise the data using a variety of charts, including bar, pie, scatter, and line diagrams. JavaFX supports numerous XY and Pie Charts.
What is the use of JavaFX charts?
A chart is a graphical method of describing data. These visualisations make it simple for many real-time applications to analyse massive amounts of data. It is mainly utilised for recording needs.
How can a pie chart be created in JavaFX?
You need to instantiate the PieChart class, describe the data, allot the data items to the PieChart object, and adjoin the chart to the application to construct a pie chart in your JavaFX application.
How can you style charts in JavaFX?
Each specific chart class's implementation determines the colours of the chart elements. However, you may change these colours and the chart symbols using CSS styles.
Conclusion
This article has given an overview of JavaFXCharts, their application, and the axes used to create them. We also learned the different types of JavaFX charts in detail.


 9+ registered

